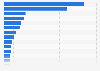
This statistic shows the revenue of sports goods manufacturing in Finland from 2008 to 2012, with a projection until 2018. In 2010, revenues of sports goods manufacturing in Finland amounted to approximately 98 million U.S. dollars.
Revenue of sports goods manufacturing (SIC 32.30) in Finland from 2008 to 2018 (in million U.S. dollars)
Other statistics that may interest you Statistics on
About the industry
10
- Basic Statistic Forecast: revenue sports goods manufacture Spain 2008-2020
- Premium Statistic Forecast: revenue sports goods manufacture France 2008-2020
- Premium Statistic Forecast: revenue sports goods manufacture Austria 2008-2020
- Basic Statistic Forecast: revenue sports goods manufacture UK 2008-2020
- Basic Statistic Forecast: revenue sports goods manufacture Germany 2008-2020
- Premium Statistic Leading Adidas products in Great Britain 2013-2021, by number of users
- Premium Statistic Converse products purchased in Great Britain 2013-2021, by clothing product type
- Premium Statistic New Balance products purchased in Great Britain 2013-2021, by clothing product type
- Premium Statistic Diadora clothing products purchased in Great Britain 2013-2021, by product type
- Premium Statistic Sports retailers market share in Norway 2018
About the region
10
- Basic Statistic Turnover of sports goods manufacture in Finland 2013-2020
- Basic Statistic Sporting equipment retail store sales in Finland 2014-2021
- Premium Statistic Finland: number of employees in the sport industry 2011 to 2017
- Premium Statistic Forecast: revenue footwear manufacture Finland 2008-2020
- Premium Statistic Leading fashion online stores in Finland 2022, by net sales
- Premium Statistic Number of football matches in Finland 2022
- Basic Statistic Number of matches played by national football team of Finland 2022, by result
- Basic Statistic Number of matches played by Finnish women's national football team 2022, by result
- Premium Statistic Number of registered football players in Finland 2015-2022
- Premium Statistic Area covered by forest in Finland 2010-2021
Selected statistics
10
- Basic Statistic Sporting goods industry: Net sales of Cybex by product type 2011
- Premium Statistic Alpine ski bindings and boots retail sales in the U.S. 2010-2016
- Premium Statistic U.S. snow sports stores snowboard boots retail inventory 2008/09-2012/13
- Basic Statistic Revenues of VF Corporation's active segment worldwide 2016 to 2023
- Basic Statistic The adidas Group's EBITDA worldwide 2000-2023
- Basic Statistic The adidas Group's financial leverage worldwide 2000-2023
- Basic Statistic The adidas Group's global net sales from 2002 to 2023, by product category
- Basic Statistic Number of Nike stores globally 2009-2023
- Basic Statistic Number of employees of the adidas Group worldwide from 2000 to 2023
- Basic Statistic Puma Group's market capitalization worldwide 1993-2023
Other regions
10
- Premium Statistic Industry revenue of “manufacture of sports goods“ in Turkey 2011-2023
- Premium Statistic Manufacture of sports goods revenue in Portugal 2010-2022
- Premium Statistic Manufacture of sports goods revenue in Poland 2010-2022
- Premium Statistic Manufacture of sports goods revenue in Malta 2010-2022
- Premium Statistic Manufacture of sports goods revenue in Ireland 2010-2022
- Basic Statistic Turnover of sports goods manufacture in Romania 2013-2020
- Premium Statistic Netherlands: skis for winter spots import value 2017-2022
- Basic Statistic Europe: skis for winter spots export value 2019, by country
- Basic Statistic Turnover of sports goods manufacture in the Czech Republic 2013-2022
- Basic Statistic Turnover of sports goods manufacture in Slovakia 2013-2020
Related statistics
10
- Basic Statistic Forecast: revenue recreational & sports goods rent and lease Germany 2009-2020
- Premium Statistic Forecast: revenue recreational & sports goods rent and lease Lithuania 2008-2020
- Basic Statistic Forecast: revenue games and toy manufacture UK 2008-2020
- Basic Statistic Forecast: revenue sports teams and clubs US 2008-2020
- Basic Statistic Forecast: revenue footwear manufacture Italy 2008-2020
- Basic Statistic Forecast: revenue knitted and crocheted fabric manufacture Germany 2009-2020
- Basic Statistic Forecast: revenue baked construction product manufacture Germany 2009-2020
- Basic Statistic Forecast: revenue fluid power equipment manufacture Germany 2009-2020
- Basic Statistic Forecast: revenue rolling stock manufacture Spain 2008-2020
- Premium Statistic Forecast: revenue footwear manufacture France 2008-2020
Further related statistics
10
- Net sales of Dick's Sporting Goods U.S. 2006-2023
- Total assets of Mizuno 2015
- The adidas Group's global footwear production from 2008-2023
- Preferred sports among Chinese millionairs 2024
- Arsenal FC revenue 2008-2023, by stream
- Liverpool FC revenue 2008-2023, by stream
- Manchester United total revenue 2005-2023
- Tottenham Hotspur revenue 2008-2023, by stream
- Baseball participation in U.S. high schools 2010-2022, by gender
- 11-player football participation in U.S. high schools 2009-2022, by gender
Further Content: You might find this interesting as well
Statistics
- Net sales of Dick's Sporting Goods U.S. 2006-2023
- Total assets of Mizuno 2015
- The adidas Group's global footwear production from 2008-2023
- Preferred sports among Chinese millionairs 2024
- Arsenal FC revenue 2008-2023, by stream
- Liverpool FC revenue 2008-2023, by stream
- Manchester United total revenue 2005-2023
- Tottenham Hotspur revenue 2008-2023, by stream
- Baseball participation in U.S. high schools 2010-2022, by gender
- 11-player football participation in U.S. high schools 2009-2022, by gender
Statista. (October 14, 2014). Revenue of sports goods manufacturing (SIC 32.30) in Finland from 2008 to 2018 (in million U.S. dollars) [Graph]. In Statista. Retrieved May 19, 2024, from https://www.statista.com/forecasts/345161/finland-sports-goods-manufacturing-revenue-forecast-sic-3230
Statista. "Revenue of sports goods manufacturing (SIC 32.30) in Finland from 2008 to 2018 (in million U.S. dollars)." Chart. October 14, 2014. Statista. Accessed May 19, 2024. https://www.statista.com/forecasts/345161/finland-sports-goods-manufacturing-revenue-forecast-sic-3230
Statista. (2014). Revenue of sports goods manufacturing (SIC 32.30) in Finland from 2008 to 2018 (in million U.S. dollars). Statista. Statista Inc.. Accessed: May 19, 2024. https://www.statista.com/forecasts/345161/finland-sports-goods-manufacturing-revenue-forecast-sic-3230
Statista. "Revenue of Sports Goods Manufacturing (Sic 32.30) in Finland from 2008 to 2018 (in Million U.S. Dollars)." Statista, Statista Inc., 14 Oct 2014, https://www.statista.com/forecasts/345161/finland-sports-goods-manufacturing-revenue-forecast-sic-3230
Statista, Revenue of sports goods manufacturing (SIC 32.30) in Finland from 2008 to 2018 (in million U.S. dollars) Statista, https://www.statista.com/forecasts/345161/finland-sports-goods-manufacturing-revenue-forecast-sic-3230 (last visited May 19, 2024)
Revenue of sports goods manufacturing (SIC 32.30) in Finland from 2008 to 2018 (in million U.S. dollars) [Graph], Statista, October 14, 2014. [Online]. Available: https://www.statista.com/forecasts/345161/finland-sports-goods-manufacturing-revenue-forecast-sic-3230