This statistic represents the share of foreign tourist arrivals from the United States into India in 2017, by port of entry. Indira Gandhi International airport in the nation's capital was the port of entry with the highest FTAs from the north American country, accounting for approximately 31 percent during the measured time period. The FTAs from the United States amounted to 1.38 million that year.
Share of foreign tourist arrivals from the United States to India, by port of entry
Basic Account
Get to know the platform
You only have access to basic statistics.
This statistic is not included in your account.
Starter Account
The ideal entry-level account for individual users
- Instant access to 1m statistics
- Download in XLS, PDF & PNG format
- Detailed references
$199 USD / Month *
Professional Account
Full access
Business Solutions including all features.
* Prices do not include sales tax.
Other statistics that may interest you Statistics on
About the industry
10
- Basic Statistic Share of foreign tourist arrivals into India via Hyderabad airport 2013-2021
- Premium Statistic Share of FTAs from United Kingdom to India 2017 by port
- Premium Statistic Share of foreign tourist arrivals into India 2011-2021, by mode of transport
- Basic Statistic Share of foreign tourist arrivals into India via Mumbai airport 2011-2021
- Basic Statistic Share of foreign tourist arrivals into India via Kolkata airport 2011-2021
- Basic Statistic Share of foreign tourist arrivals into India via Chennai airport 2011-2021
- Basic Statistic Share of foreign tourist arrivals into India via Delhi airport 2011-2021
- Basic Statistic Share of foreign tourist arrivals into India via Bengaluru airport 2011-2021
- Premium Statistic Share of foreign tourist arrivals from Canada in India - by port of entry 2017
- Premium Statistic Share of foreign tourist arrivals from Bangladesh in India - by port of arrival 2017
About the region
10
- Premium Statistic 
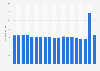
Share of foreign tourist arrivals from United States to India 2021, by purpose
- Premium Statistic Share of FTAs from United Kingdom to India 2021, by purpose of visit
- Premium Statistic Foreign tourist arrivals from eastern Europe into India 2021, by leading country
- Premium Statistic Share of foreign tourist arrivals into India 2022, by region
- Premium Statistic Foreign tourist arrivals from Africa into India 2021, by leading country
- Premium Statistic Foreign tourist arrivals from the Americas into India 2021, by leading country
- Premium Statistic Foreign tourist arrivals from west Asia into India 2021, by leading country
- Premium Statistic Foreign tourist arrivals from south Asia into India 2021, by leading country
- Premium Statistic Foreign tourist arrivals from south east Asia into India 2021, by leading country
- Premium Statistic FTAs from west Asian countries in India 2021, by average duration of stay
Selected statistics
6
- Basic Statistic International tourism receipts of India 2011-2022
- Premium Statistic Change in number of visitors from Mexico to the U.S. 2018-2024
- Premium Statistic Annual revenue of China Tourism Group Duty Free 2013-2023
- Premium Statistic Countries with the highest number of inbound tourist arrivals worldwide 2019-2022
- Basic Statistic Foreign exchange earnings from tourism in India 2000-2022
- Basic Statistic Number of international tourist arrivals in India 2010-2021
Other regions
10
- Premium Statistic Inbound visitors from the UAE in South Korea 2012-2016
- Premium Statistic Inbound tourism: overnight stays in hotels in Hungary 2019-2021
- Premium Statistic Accommodation types used by backpackers visiting NSW 2016
- Premium Statistic Visitors to the Canary Islands 2022, by island of destination
- Premium Statistic Inbound tourism volume in Mexico 2016-2022
- Premium Statistic Total number of visitors from India in 5-star hotels in Macao 2013-2023
- Premium Statistic COVID-19 impact on inbound tourism volume in Latin American subregions 2020-2021
- Premium Statistic Number of inbound tourists in Ireland 2018-2019, by country
- Premium Statistic European Union (EU) Schengen visas issued in Russia 2010-2021
- Premium Statistic European Union (EU) Schengen visas issued in China 2010-2021
Related statistics
10
- Premium Statistic Share of foreign tourist arrivals from Bangladesh in India 2021, by purpose of visit
- Premium Statistic Share of foreign tourist arrivals into India from the United States by age group 2017
- Premium Statistic FTAs from eastern Europe in India - by duration of stay 2017
- Premium Statistic FTAs from south Asia in India - by duration of stay 2017
- Premium Statistic FTAs from southeast Asia in India - by duration of stay 2017
- Premium Statistic Foreign tourist arrivals from east Asia into India by country 2017
- Premium Statistic Share of foreign tourist arrivals from Canada in India - by purpose 2017
- Premium Statistic Share of foreign tourist arrivals from Australia in India - by purpose 2017
- Premium Statistic Foreign tourist arrivals from Americas in India - by duration of stay 2017
- Premium Statistic Share of foreign tourist arrivals into India from United Kingdom 2021, by age group
Further related statistics
9
- Number of international tourist arrivals APAC 2019, by country or region
- Passenger traffic at Dubai Airports from 2010 to 2020*
- Busch Gardens Tampa Bay theme park attendance 2009-2022
- Walt Disney World Magic Kingdom theme park attendance 2009-2022
- Disneyland theme park (California) attendance 2009-2022
- Walt Disney World Animal Kingdom theme park attendance 2009-2022
- Universal Orlando Islands of Adventure theme park attendance 2009-2022
- Most visited amusement and theme parks in North America 2022
- Change in attendance at amusement and theme parks in Europe 2019-2022
Further Content: You might find this interesting as well
Statistics
- Number of international tourist arrivals APAC 2019, by country or region
- Passenger traffic at Dubai Airports from 2010 to 2020*
- Busch Gardens Tampa Bay theme park attendance 2009-2022
- Walt Disney World Magic Kingdom theme park attendance 2009-2022
- Disneyland theme park (California) attendance 2009-2022
- Walt Disney World Animal Kingdom theme park attendance 2009-2022
- Universal Orlando Islands of Adventure theme park attendance 2009-2022
- Most visited amusement and theme parks in North America 2022
- Change in attendance at amusement and theme parks in Europe 2019-2022
Ministry of Tourism (India). (April 4, 2019). Share of foreign tourist arrivals from the United States to India, by port of entry [Graph]. In Statista. Retrieved April 20, 2024, from https://www.statista.com/statistics/1015011/india-share-of-fta-from-the-united-states-by-port/
Ministry of Tourism (India). "Share of foreign tourist arrivals from the United States to India, by port of entry." Chart. April 4, 2019. Statista. Accessed April 20, 2024. https://www.statista.com/statistics/1015011/india-share-of-fta-from-the-united-states-by-port/
Ministry of Tourism (India). (2019). Share of foreign tourist arrivals from the United States to India, by port of entry. Statista. Statista Inc.. Accessed: April 20, 2024. https://www.statista.com/statistics/1015011/india-share-of-fta-from-the-united-states-by-port/
Ministry of Tourism (India). "Share of Foreign Tourist Arrivals from The United States to India, by Port of Entry." Statista, Statista Inc., 4 Apr 2019, https://www.statista.com/statistics/1015011/india-share-of-fta-from-the-united-states-by-port/
Ministry of Tourism (India), Share of foreign tourist arrivals from the United States to India, by port of entry Statista, https://www.statista.com/statistics/1015011/india-share-of-fta-from-the-united-states-by-port/ (last visited April 20, 2024)
Share of foreign tourist arrivals from the United States to India, by port of entry [Graph], Ministry of Tourism (India), April 4, 2019. [Online]. Available: https://www.statista.com/statistics/1015011/india-share-of-fta-from-the-united-states-by-port/