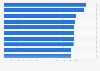
Share of individuals practicing sports in Italy 2019, by gender and age group

Distribution of individuals practicing sports in Italy in 2019, by gender and age group

Download
Show detailed source information?
Register for free
Already a member?
Log in
Source

Use Ask Statista Research Service

Release date

July 2019

Region

Italy

Survey time period

2019

Age group

11 years and older

Special properties

Women and men practicing sports regularly

Supplementary notes

The source does not specify the methodology used for the survey.

Citation formats
Statista Accounts: Access All Statistics. Starting from $2,388 USD / Year
Basic Account
Get to know the platform

You only have access to basic statistics.
This statistic is not included in your account.

Starter Account
The ideal entry-level account for individual users
  • Instant access to 1m statistics
  • Download in XLS, PDF & PNG format
  • Detailed references
$199 USD / Month *
Professional Account
Full access

Business Solutions including all features.

* Prices do not include sales tax.

Statistics on " Women's sport participation in Italy "

Other statistics that may interest you Women's sport participation in Italy

Overview

5

Soccer

5

Volleyball

5

Basketball

3

Rugby

3

Cycling

4

Other sports

5

Leading athletes

6

Further related statistics

17
Statista Accounts: Access All Statistics. Starting from $2,388 USD / Year
Learn more about how Statista can support your business.