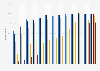
Frequency of e-payment service usage India 2020, by age group
According to a survey conducted by Rakuten Insight, a large share of respondents between 16 to 54 years of age stated to have frequently used some form of e-payment method as of February 2020. Around 30 percent of respondents between 16 to 34 years of age stated that they used electronic payment methods everyday, whereas only six percent of respondents who were 55 years or older used e-payment methods daily in the south Asian country.