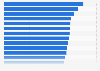
In a survey conducted in 2019, 58 percent of the respondents in Malaysia stated that they discovered new products via social media rather than other online or offline means. Comparatively, 48 percent of respondents in Vietnam stated during the same survey that they discovered new products on social media as opposed to other online or offline means.
Share of respondents who discover new products via social media in Southeast Asia in 2019, by country or region
Basic Account
Get to know the platform
You only have access to basic statistics.
This statistic is not included in your account.
Starter Account
The ideal entry-level account for individual users
- Instant access to 1m statistics
- Download in XLS, PDF & PNG format
- Detailed references
$199 USD / Month *
Professional Account
Full access
Business Solutions including all features.
* Prices do not include sales tax.
Other statistics that may interest you Statistics on
About the industry
10
- Premium Statistic E-commerce user penetration in Spain 2010-2021
- Premium Statistic Social e-commerce industry growth in China 2015-2021
- Premium Statistic Market size of social e-commerce industry China 2014-2022
- Basic Statistic Most commonly purchased products online in the Nordics 2023
- Premium Statistic Grupo Falabella: e-retail sales share 2018-2021, by quarter
- Premium Statistic Revenues of e-commerce markets in the Nordic countries 2019
- Premium Statistic Share of online shoppers who can choose delivery method in Sweden 2020, by product
- Premium Statistic Mobile shopping transaction value fashion South Korea 2019, by category
- Basic Statistic Revenue of the e-commerce industry in the U.S. 2019-2029
- Premium Statistic Revenue per user of e-commerce in Russia 2020-2029
About the region
10
- Premium Statistic Share of online urban fashion buyers in India 2013-2020
- Premium Statistic Share of interest in online banking services in UAE by offer 2016
- Premium Statistic Willingness to open a online bank account without physical branch in the UAE 2016
- Premium Statistic Share of willingness to migrate banking services to online in the UAE by product 2016
- Premium Statistic Share of online banking preference in Saudi Arabia by activity 2016
- Premium Statistic Share of preference in online banking services in the UAE by activity 2016
- Premium Statistic Share of interest in online banking services in Saudi Arabia by offer 2016
- Premium Statistic Share of interest in opening an account with a bank in Saudi Arabia 2016
- Premium Statistic X (Twitter) monthly market share Asia 2023-2024
- Premium Statistic Instagram monthly market share Asia 2023-2024
Selected statistics
1
Other regions
10
- Premium Statistic Monthly average expenditure on online shopping South Korea 2022
- Premium Statistic Number of U.S. social buyers 2021-2027
- Premium Statistic Ratio of social commerce live-sales to comments Thailand Q1-Q2 2020
- Premium Statistic Generation Z online purchasing frequency in Poland 2018
- Premium Statistic Delivery speed satisfaction among online shoppers in Sweden 2019
- Premium Statistic Colombia: number of Cyber Monday website visits 2016-2019
- Premium Statistic Share of online shopper preference MENA 2020, by reason and country
- Premium Statistic Services to which online shoppers subscribed in Denmark 2019
- Premium Statistic Argentina: number of visitors on Cyber Monday 2015-2020
- Premium Statistic Leading product categories purchased on social media in Singapore Q1-Q2 2021
Related statistics
10
- Premium Statistic Frequency of online shopping before and after COVID-19 APAC 2020
- Premium Statistic Number of active buyers on Alibaba in Nepal 2015-2017
- Premium Statistic Distribution of e-commerce exports from Bangladesh 2017, by type
- Premium Statistic Distribution of e-commerce exports from Cambodia 2017, by type
- Premium Statistic Distribution of e-commerce exports from Laos 2017, by type
- Premium Statistic Number of registered sellers on Alibaba in Bangladesh 2015-2017
- Premium Statistic Distribution of e-commerce exports from Myanmar 2017, by type
- Premium Statistic Number of registered sellers on Alibaba in Cambodia 2015-2017
- Premium Statistic Distribution of e-commerce exports from Nepal 2017, by type
- Premium Statistic Number of registered sellers on Alibaba in Myanmar 2015-2017
Further related statistics
9
- Travel arrangements: Online purchasing in Great Britain 2019, by demographic
- Consumer electronics: Online purchasing in Great Britain 2020, by demographic
- Computer software: Online purchasing in Great Britain 2020, by age group
- User numbers of microblogs in China 2010-2018
- Leading trends in technology in restaurants in the U.S. 2015*
- Where consumers shop for clothing and footwear in the United Kingdom (UK) 2013
- Channels consumers use for their main grocery shop in the United Kingdom (UK) 2013
- Furniture shopping: Consumers' delivery preferences in the United Kingdom (UK) 2013
- Reasons for using social media to get a customer service response 2012
Further Content: You might find this interesting as well
Statistics
- Travel arrangements: Online purchasing in Great Britain 2019, by demographic
- Consumer electronics: Online purchasing in Great Britain 2020, by demographic
- Computer software: Online purchasing in Great Britain 2020, by age group
- User numbers of microblogs in China 2010-2018
- Leading trends in technology in restaurants in the U.S. 2015*
- Where consumers shop for clothing and footwear in the United Kingdom (UK) 2013
- Channels consumers use for their main grocery shop in the United Kingdom (UK) 2013
- Furniture shopping: Consumers' delivery preferences in the United Kingdom (UK) 2013
- Reasons for using social media to get a customer service response 2012
Bain & Company. (January 11, 2020). Share of respondents who discover new products via social media in Southeast Asia in 2019, by country or region [Graph]. In Statista. Retrieved April 27, 2024, from https://www.statista.com/statistics/1148096/sea-respondents-who-discover-products-on-social-media-by-country-or-region/
Bain & Company. "Share of respondents who discover new products via social media in Southeast Asia in 2019, by country or region." Chart. January 11, 2020. Statista. Accessed April 27, 2024. https://www.statista.com/statistics/1148096/sea-respondents-who-discover-products-on-social-media-by-country-or-region/
Bain & Company. (2020). Share of respondents who discover new products via social media in Southeast Asia in 2019, by country or region. Statista. Statista Inc.. Accessed: April 27, 2024. https://www.statista.com/statistics/1148096/sea-respondents-who-discover-products-on-social-media-by-country-or-region/
Bain & Company. "Share of Respondents Who Discover New Products via Social Media in Southeast Asia in 2019, by Country or Region." Statista, Statista Inc., 11 Jan 2020, https://www.statista.com/statistics/1148096/sea-respondents-who-discover-products-on-social-media-by-country-or-region/
Bain & Company, Share of respondents who discover new products via social media in Southeast Asia in 2019, by country or region Statista, https://www.statista.com/statistics/1148096/sea-respondents-who-discover-products-on-social-media-by-country-or-region/ (last visited April 27, 2024)
Share of respondents who discover new products via social media in Southeast Asia in 2019, by country or region [Graph], Bain & Company, January 11, 2020. [Online]. Available: https://www.statista.com/statistics/1148096/sea-respondents-who-discover-products-on-social-media-by-country-or-region/