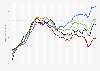
In 2020, the imports of durable consumer goods to Japan increased by four index points compared to the base year 2015. The imports of durable consumer goods remained above the level of the base year for four consecutive years.
Import index of durable consumer goods in Japan from 2013 to 2020
Basic Account
Get to know the platform
You only have access to basic statistics.
This statistic is not included in your account.
Starter Account
The ideal entry-level account for individual users
- Instant access to 1m statistics
- Download in XLS, PDF & PNG format
- Detailed references
$199 USD / Month *
Professional Account
Full access
Business Solutions including all features.
* Prices do not include sales tax.
Other statistics that may interest you Statistics on
About the industry
10
- Premium Statistic Nondurable consumer goods import index in Japan 2013-2022
- Premium Statistic Monthly import value of consumer goods in Canada 2015-2023
- Premium Statistic Share of vending machines in Japan 2022, by type
- Premium Statistic Number of vending machines in Japan 2022, by type
- Premium Statistic CPI of nondurable consumer goods in Japan 2013-2022
- Basic Statistic Imports and exports of fireworks to and from Germany 2006-2023
- Premium Statistic Monthly CPI for alcoholic beverages and tobacco in Morocco 2019-2022
- Premium Statistic Value of the leading office and telecom equipment exporters worldwide 2022
- Premium Statistic Value of the leading office and telecom equipment importers worldwide 2022
- Basic Statistic Michigan's imports and exports of goods 2017-2024
About the region
10
- Premium Statistic Grain self-sufficiency ratio in Japan FY 2013-2022
- Premium Statistic Beef self-sufficiency ratio in Japan FY 2013-2022
- Premium Statistic Rice self-sufficiency ratio Japan FY 2013-2022
- Premium Statistic Fish and shellfish self-sufficiency ratio in Japan FY 2013-2022
- Premium Statistic Wheat self-sufficiency ratio in Japan FY 2013-2022
- Premium Statistic Seaweed self-sufficiency ratio in Japan FY 2013-2022
- Premium Statistic Barley self-sufficiency ratio in Japan FY 2013-2022
- Premium Statistic Sugar self-sufficiency ratio in Japan FY 2013-2022
- Premium Statistic Potato and sweet potato self-sufficiency ratio in Japan FY 2013-2022
- Premium Statistic Oils and fats self-sufficiency ratio in Japan FY 2013-2022
Selected statistics
2
Other regions
10
- Basic Statistic Monthly import value of prepared and packaged seafood products in Canada 2015-2023
- Premium Statistic Import value of self-propelled works trucks from the UK 2014-2022
- Basic Statistic Annual volume of milk supplied in the Netherlands 2000-2021
- Premium Statistic Global smart speaker shipments 2016-2020, by vendor
- Basic Statistic California's imports and exports of goods 2017-2024
- Basic Statistic Most important import partners of Brunei Darussalam 2019
- Basic Statistic Main import partners of Afghanistan 2021
- Basic Statistic Most important import partners of the Central African Republic 2019
- Basic Statistic Most important import partners of Cuba 2019
- Basic Statistic Most important import partners of Chad 2019
Related statistics
10
- Premium Statistic Expectations of consumer goods price development in Japan 2023
- Premium Statistic Beer import volume to Japan 2014-2022
- Premium Statistic Beer import value to Japan 2014-2022
- Premium Statistic Total value of U.S. trade in goods with Japan 2014-2023
- Premium Statistic Import of goods to Japan from Vietnam 2013 to 2022
- Premium Statistic Import of goods to Japan from Malaysia 2013-2022
- Basic Statistic Value of textile and apparel imports to Japan from the U.S. 2012-2021
- Premium Statistic Commodities import value to Japan 2023, by category
- Premium Statistic Canned tuna production volume in Japan 2013-2022
- Premium Statistic Canned drinks production volume Japan 2013-2022
Further Content: You might find this interesting as well
Statistics
METI (Japan). (March 8, 2021). Import index of durable consumer goods in Japan from 2013 to 2020 [Graph]. In Statista. Retrieved May 08, 2024, from https://www.statista.com/statistics/1224849/japan-import-index-durable-consumer-goods/
METI (Japan). "Import index of durable consumer goods in Japan from 2013 to 2020." Chart. March 8, 2021. Statista. Accessed May 08, 2024. https://www.statista.com/statistics/1224849/japan-import-index-durable-consumer-goods/
METI (Japan). (2021). Import index of durable consumer goods in Japan from 2013 to 2020. Statista. Statista Inc.. Accessed: May 08, 2024. https://www.statista.com/statistics/1224849/japan-import-index-durable-consumer-goods/
METI (Japan). "Import Index of Durable Consumer Goods in Japan from 2013 to 2020." Statista, Statista Inc., 8 Mar 2021, https://www.statista.com/statistics/1224849/japan-import-index-durable-consumer-goods/
METI (Japan), Import index of durable consumer goods in Japan from 2013 to 2020 Statista, https://www.statista.com/statistics/1224849/japan-import-index-durable-consumer-goods/ (last visited May 08, 2024)
Import index of durable consumer goods in Japan from 2013 to 2020 [Graph], METI (Japan), March 8, 2021. [Online]. Available: https://www.statista.com/statistics/1224849/japan-import-index-durable-consumer-goods/