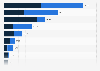
This graph shows the inbound transaction volume of international visa cards to the U.S. in major merchant categories from 2008 to 2010. In 2008, 5.2 billion U.S. dollars were spent on lodging.
Inbound spending by international visa card holders in the U.S. by market segment from 2008 to 2010 (in billion U.S. dollars)
Basic Account
Get to know the platform
You only have access to basic statistics.
This statistic is not included in your account.
Starter Account
The ideal entry-level account for individual users
- Instant access to 1m statistics
- Download in XLS, PDF & PNG format
- Detailed references
$199 USD / Month *
Professional Account
Full access
Business Solutions including all features.
* Prices do not include sales tax.
Other statistics that may interest you Statistics on
About the industry
10
- Basic Statistic Outbound spending by U.S. visa cards in other countries 2008-2010
- Basic Statistic Change in spending by U.S. visa credt card holders in other countries 2008-2010
- Premium Statistic Holidays abroad spent in hotel or motel accommodations by Dutch tourists 2005-2016
- Basic Statistic Inbound tourism spending in the U.S. by state for the first half of 2010
- Premium Statistic Tourist arrivals domestic and foreign in Germany in 2023, by federal state
- Premium Statistic Number of domestic leisure trips in paid accommodations in Finland 2012-2022
- Basic Statistic Number of overnight stays in Luxembourg 2010-2020
- Premium Statistic Monthly inbound overnight stays in tourist accommodations in Milan 2019-2020
- Basic Statistic Preferred accommodations for summer holidays in Italy during the coronavirus 2020
- Premium Statistic Expenditure on holidays abroad in the Netherlands 2017-2018, by accommodation type
About the region
10
- Basic Statistic Growth of inbound spending in the U.S. using foreign visa credit cards
- Premium Statistic Quarterly average daily rate outlook for the U.S. lodging industry from 2019-2022
- Premium Statistic Quarterly Airbnb rental figures in LA 2016-2019
- Premium Statistic Airbnb rentals in Los Angeles in the U.S. 2010-2018
- Premium Statistic Number of visitor arrivals from the U.S. to Macao 2013-2023, by transport mode
- Premium Statistic Number of tourist arrivals from the U.S. to Europe 2019-2022, by destination
- Premium Statistic Casino hotel industry market size in the U.S. 2011-2022
- Premium Statistic Casino hotel industry business count in the U.S. 2011-2022
- Premium Statistic Casino hotel industry employee count in the U.S. 2011-2022
- Premium Statistic U.S. tour operator industry market size 2012-2022
Selected statistics
8
- Premium Statistic Extended stay lodging units: total number in the U.S. 2008-2016
- Basic Statistic Contribution of China's travel and tourism industry to GDP 2014-2023
- Premium Statistic Music tourist spending at concerts and festivals in the United Kingdom (UK) 2012-2016
- Basic Statistic Importance of BRICS countries to UK tourism businesses 2011
- Premium Statistic Number of visitors to the U.S. from Russia 2011-2022
- Premium Statistic Number of international tourist arrivals APAC 2019, by country or region
- Premium Statistic Middle Eastern countries with the largest international tourism receipts 2018
- Premium Statistic Business class air fares used by corporate clients - growth forecast 2011-2012
Other regions
10
- Premium Statistic Share of investments in tourism in Grand Est, France 2014-2016, by sector
- Premium Statistic Revenue of hotels per available hotel room in the Netherlands 2013-2018
- Premium Statistic Capacity of hotels in Belgium 2011-2020
- Premium Statistic Kempinski AG revenue 2010
- Premium Statistic Mexico: share of paid jobs in tourism by service type 2017
- Premium Statistic Number of overnight stays in hotels in the Faroe Islands 2019, by country of origin
- Premium Statistic Available capacity of hotels in Switzerland 2007-2019
- Basic Statistic Number of overnight stays after COVID-19 in Denmark 2020, by accommodation type
- Premium Statistic Number of domestic and international overnight stays in hotels in Sweden 2018
- Premium Statistic Number of rooms in tourist accommodations in Vietnam 2019-2023
Related statistics
7
- Premium Statistic Capacity of TUI AG hotels and resorts 2008-2023, by brand
- Premium Statistic Occupancy rate of TUI AG hotels and resorts 2008-2023, by brand
- Premium Statistic Average length of stay in hotels in Switzerland 2007-2019
- Premium Statistic Number of hotel bed-places in Cyprus 2007-2019
- Premium Statistic Available capacity of hotels in Cyprus 2007-2019
- Premium Statistic Number of hotel bed-places in Greece 2007-2019
- Premium Statistic Number of hotel bed-places in Ireland 2007-2019
Further related statistics
10
- Operating income of the InterContinental Hotels Group 2007-2023
- Total assets of the InterContinental Hotels Group 2007-2023
- Income of the InterContinental Hotels Group 2007-2023
- Foreign exchange earnings from tourism in India 2000-2022
- Change in number of visitors from Mexico to the U.S. 2018-2024
- Annual revenue of China Tourism Group Duty Free 2013-2023
- Revenue of the InterContinental Hotels Group 2008-2023, by ownership type
- Number of employees of the InterContinental Hotel Group 2023
- Revenue of the InterContinental Hotels Group 2007-2023
- Countries with the highest number of inbound tourist arrivals worldwide 2019-2022
Further Content: You might find this interesting as well
Statistics
- Operating income of the InterContinental Hotels Group 2007-2023
- Total assets of the InterContinental Hotels Group 2007-2023
- Income of the InterContinental Hotels Group 2007-2023
- Foreign exchange earnings from tourism in India 2000-2022
- Change in number of visitors from Mexico to the U.S. 2018-2024
- Annual revenue of China Tourism Group Duty Free 2013-2023
- Revenue of the InterContinental Hotels Group 2008-2023, by ownership type
- Number of employees of the InterContinental Hotel Group 2023
- Revenue of the InterContinental Hotels Group 2007-2023
- Countries with the highest number of inbound tourist arrivals worldwide 2019-2022
Visa Inc.. (April 30, 2011). Inbound spending by international visa card holders in the U.S. by market segment from 2008 to 2010 (in billion U.S. dollars) [Graph]. In Statista. Retrieved April 19, 2024, from https://www.statista.com/statistics/185223/inbound-spending-from-international-visa-cards-in-us-since-2008/
Visa Inc.. "Inbound spending by international visa card holders in the U.S. by market segment from 2008 to 2010 (in billion U.S. dollars) ." Chart. April 30, 2011. Statista. Accessed April 19, 2024. https://www.statista.com/statistics/185223/inbound-spending-from-international-visa-cards-in-us-since-2008/
Visa Inc.. (2011). Inbound spending by international visa card holders in the U.S. by market segment from 2008 to 2010 (in billion U.S. dollars) . Statista. Statista Inc.. Accessed: April 19, 2024. https://www.statista.com/statistics/185223/inbound-spending-from-international-visa-cards-in-us-since-2008/
Visa Inc.. "Inbound Spending by International Visa Card Holders in The U.S. by Market Segment from 2008 to 2010 (in Billion U.S. Dollars) ." Statista, Statista Inc., 30 Apr 2011, https://www.statista.com/statistics/185223/inbound-spending-from-international-visa-cards-in-us-since-2008/
Visa Inc., Inbound spending by international visa card holders in the U.S. by market segment from 2008 to 2010 (in billion U.S. dollars) Statista, https://www.statista.com/statistics/185223/inbound-spending-from-international-visa-cards-in-us-since-2008/ (last visited April 19, 2024)
Inbound spending by international visa card holders in the U.S. by market segment from 2008 to 2010 (in billion U.S. dollars) [Graph], Visa Inc., April 30, 2011. [Online]. Available: https://www.statista.com/statistics/185223/inbound-spending-from-international-visa-cards-in-us-since-2008/