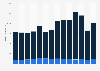
China: SAIC auto sales by type 2009-2021

Vehicle sales of China's SAIC Group from 2009 to 2021, by type

Download
Show detailed source information?
Register for free
Already a member?
Log in
Source

Use Ask Statista Research Service

Release date

April 2022

Region

China

Survey time period

2009 to 2021

Supplementary notes

Figures were rounded.
*Figures from 2009 to 2019 were taken from previous reports.

Citation formats
Statista Accounts: Access All Statistics. Starting from $2,388 USD / Year
Basic Account
Get to know the platform

You only have access to basic statistics.
This statistic is not included in your account.

Starter Account
The ideal entry-level account for individual users
  • Instant access to 1m statistics
  • Download in XLS, PDF & PNG format
  • Detailed references
$199 USD / Month *
Professional Account
Full access

Business Solutions including all features.

* Prices do not include sales tax.

Statistics on " Automobile sales in China "

Other statistics that may interest you Automobile sales in China

Global market

4

China overview

7

Manufacturers

7

Used car market

5

Consumers

4

Further related statistics

20
Statista Accounts: Access All Statistics. Starting from $2,388 USD / Year
Learn more about how Statista can support your business.