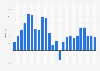
Global reserves distribution of iron ore, gold, and copper by location 2012
This statistic shows the global reserves distribution of iron ore, gold and copper in 2012, sorted by location. As at January 2012, some 34 percent of global iron ore reserves were located in countries of the so called developed world.