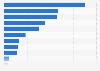
This statistic depicts the annual net income of Pan American Silver from 2008 to 2018. In 2018, the company's annual net income amounted to 12 million U.S. dollars. Pan American Silver Corporation is a Canadian mining company based in Vancouver, and one of the world's leading primary producers of silver.
Net income of the Pan American Silver Corporation from 2008 to 2018 (in million U.S. dollars)
Loading statistic...
Basic Account
Get to know the platform
You only have access to basic statistics.
Starter Account
The ideal entry-level account for individual users
- Instant access to 1m statistics
- Download in XLS, PDF & PNG format
- Detailed references
$199 USD / Month *
Professional Account
Full access
Business Solutions including all features.
* Prices do not include sales tax.
Other statistics that may interest you Statistics on
About the industry
10
- Basic Statistic Gross profit of Fresnillo 2008-2018
- Basic Statistic Revenue of Fresnillo 2010-2022
- Basic Statistic Pan American Silver's production by metal 2018-2022
- Basic Statistic EBITDA of Fresnillo 2008-2019
- Premium Statistic Vale's net operating revenue 2022, by region
- Premium Statistic Vale's net operating revenue 2022, by segment
- Premium Statistic KGHM Group sales revenue and net profit in Poland 2014-2022
- Premium Statistic KGHM Polska Miedź sales revenues in Poland 2020-2022, by product
- Premium Statistic Leading global uranium mines 2022, based on production
- Premium Statistic Revenue of SNC Lavalin 2022, by segment
About the region
10
- Premium Statistic Kimberly-Clark's revenue by business segment 2015-2023
- Basic Statistic Kimberly-Clark's net sales by geographic area 2017-2023
- Premium Statistic Revenue of Pan American Silver 2010-2022
- Basic Statistic Global net sales of Gildan 2022, by segment
- Premium Statistic Primark revenues worldwide 2007-2023
- Premium Statistic Fresnillo's number of employees 2010-2021
- Basic Statistic Global net sales of Gildan 2021, by region
- Basic Statistic Fresnillo's number of employee fatalities 2008-2019
- Premium Statistic Global silver supply distribution by source 2014
- Premium Statistic Projection of the automotive semiconductor market size 2020-2030
Selected statistics
7
- Premium Statistic Glencore's net income 2010-2023
- Premium Statistic Number of Rio Tinto's employees 2010-2023
- Basic Statistic Rio Tinto's net income 2005-2023
- Premium Statistic Rio Tinto's uranium production 2010-2023
- Basic Statistic Rio Tinto's aluminum and copper production 2010-2023
- Premium Statistic Development of global gold stocks 2000-2015
- Basic Statistic Mine lifespan by selected commodities
Other regions
10
- Basic Statistic Kimberly-Clark's revenue 2008-2023
- Premium Statistic Financial results of Bauer Media Group in Poland 2021-2022
- Premium Statistic Associated British Foods group revenue worldwide 2008-2022, by sector
- Premium Statistic Net sales of Posti Group 2016-2021
- Premium Statistic Production share of silver powder annually by major country 2011-2017
- Premium Statistic Net sales of Growmark, Inc. company in the U.S. & Canada from 2014 to 2018
- Premium Statistic Net sales of Rimi Baltic 2014-2021
- Premium Statistic E-commerce revenue in Norway 2012-2021
- Premium Statistic Revenue of Bonnier AB 2009-2022
- Premium Statistic Revenue of Telstra Australia FY 2015-2023
Related statistics
10
- Basic Statistic Global silver production by primary source metal 2018-2022
- Basic Statistic Distribution of global silver production 2022, by primary source metal
- Premium Statistic Global diamond production share of major companies 2019
- Premium Statistic World physical silver demand change by sector 2017
- Premium Statistic World physical silver demand change percentage by sector 2017
- Premium Statistic World silver demand annual change by industrial application 2016
- Premium Statistic World silver demand distribution by sector 2004 and 2014
- Premium Statistic Orano's revenue 2010-2022
- Basic Statistic Annual silver production of Fresnillo 2010-2022
- Premium Statistic Vale's nickel production 2010-2022
Further related statistics
10
- Agnico-Eagle Mines' average gold price realized 2010-2022
- Glencore's sales of energy products 2010-2023
- Net revenue from investment banking at Goldman Sachs 2009-2023
- Sales of International House of Pancakes (IHOP) restaurants in the U.S. 2009-2023
- Number of people working in fishing and aquaculture worldwide 1995-2020
- Annual silver production of Coeur Mining 2010-2021
- Net revenue from investing and lending at Goldman Sachs 2009-2021
- Biofuels related jobs worldwide by region 2019
- Global natural gas production in oil equivalent 1998-2019
- Cocoa consumption worldwide by region 2016
Further Content: You might find this interesting as well
Statistics
- Agnico-Eagle Mines' average gold price realized 2010-2022
- Glencore's sales of energy products 2010-2023
- Net revenue from investment banking at Goldman Sachs 2009-2023
- Sales of International House of Pancakes (IHOP) restaurants in the U.S. 2009-2023
- Number of people working in fishing and aquaculture worldwide 1995-2020
- Annual silver production of Coeur Mining 2010-2021
- Net revenue from investing and lending at Goldman Sachs 2009-2021
- Biofuels related jobs worldwide by region 2019
- Global natural gas production in oil equivalent 1998-2019
- Cocoa consumption worldwide by region 2016
Pan American Silver. (March 14, 2019). Net income of the Pan American Silver Corporation from 2008 to 2018 (in million U.S. dollars) [Graph]. In Statista. Retrieved April 24, 2024, from https://www.statista.com/statistics/253614/pan-americans-annual-net-income-since-2008/
Pan American Silver. "Net income of the Pan American Silver Corporation from 2008 to 2018 (in million U.S. dollars)." Chart. March 14, 2019. Statista. Accessed April 24, 2024. https://www.statista.com/statistics/253614/pan-americans-annual-net-income-since-2008/
Pan American Silver. (2019). Net income of the Pan American Silver Corporation from 2008 to 2018 (in million U.S. dollars). Statista. Statista Inc.. Accessed: April 24, 2024. https://www.statista.com/statistics/253614/pan-americans-annual-net-income-since-2008/
Pan American Silver. "Net Income of The Pan American Silver Corporation from 2008 to 2018 (in Million U.S. Dollars)." Statista, Statista Inc., 14 Mar 2019, https://www.statista.com/statistics/253614/pan-americans-annual-net-income-since-2008/
Pan American Silver, Net income of the Pan American Silver Corporation from 2008 to 2018 (in million U.S. dollars) Statista, https://www.statista.com/statistics/253614/pan-americans-annual-net-income-since-2008/ (last visited April 24, 2024)
Net income of the Pan American Silver Corporation from 2008 to 2018 (in million U.S. dollars) [Graph], Pan American Silver, March 14, 2019. [Online]. Available: https://www.statista.com/statistics/253614/pan-americans-annual-net-income-since-2008/