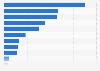
In 2016, the total global value of all mergers and acquisitions in which gold was the target commodity was 5.07 billion U.S. dollars. This statistic shows the value of mining industry merger and acquisition deals made around the world in 2016 and year-to-date as of October 2017, by target commodity.
Mining industry merger and acquisition deal value worldwide in 2016 and 2017 by commodity (in million U.S. dollars)
Basic Account
Get to know the platform
You only have access to basic statistics.
This statistic is not included in your account.
Starter Account
The ideal entry-level account for individual users
- Instant access to 1m statistics
- Download in XLS, PDF & PNG format
- Detailed references
$199 USD / Month *
Professional Account
Full access
Business Solutions including all features.
* Prices do not include sales tax.
Other statistics that may interest you Statistics on
About the industry
10
- Premium Statistic Global market size of selected metals 2022
- Basic Statistic Number of global mining and metals sector deals by commodity 2017
- Premium Statistic Capex distribution for top mineral commodities worldwide 2016
- Premium Statistic South Africa's mining industry employment by commodity 2023
- Premium Statistic Global key risks for the mining and metals industry Q3 & Q4 2020
- Premium Statistic Import dependence for non-ferrous metal ores in the European Union (EU) 2018
- Premium Statistic Mining investments in Yukon 2015-2017
- Basic Statistic Mine lifespan by selected commodities
- Premium Statistic Total value of mining transactions in Canada 2000-2010
- Premium Statistic BHP's market capitalization 2010-2024
About the region
10
- Premium Statistic Norilsk Nickel's number of employees 2010-2022
- Premium Statistic Quarterly number of M&A deals in the global chemical sector Q1 2017-Q4 2022
- Basic Statistic Global silver production by primary source metal 2018-2022
- Basic Statistic Distribution of global silver production 2022, by primary source metal
- Premium Statistic Norilsk Nickel's annual revenue 2010-2023
- Premium Statistic Norilsk Nickel's profit 2010-2022
- Premium Statistic Fresnillo's number of employees 2010-2021
- Premium Statistic Global mineral commodity price recovery prospects post-COVID-19 2020
- Basic Statistic Fresnillo's number of employee fatalities 2008-2019
- Premium Statistic Global number of active mineral exploration sites 2017, by region and type
Selected statistics
9
- Basic Statistic Rio Tinto's net income 2005-2023
- Basic Statistic Rio Tinto's aluminum and copper production 2010-2023
- Premium Statistic Number of Rio Tinto's employees 2010-2023
- Premium Statistic Rio Tinto's uranium production 2010-2023
- Premium Statistic Glencore's net income 2010-2023
- Premium Statistic Freeport-McMoRan's revenue 2010-2023
- Basic Statistic Freeport-McMoRan's net income 2010-2023
- Premium Statistic Development of global gold stocks 2000-2015
- Basic Statistic Global leading silver consumers 2010
Other regions
10
- Basic Statistic Canada's leading minerals by production value 2015
- Premium Statistic Financial advisors ranked by M&A deal count in the Netherlands 2022
- Premium Statistic Number of M&A deals in Italy H1 2021, by sector
- Basic Statistic Estimated value of mineral resources Mongolia 2013
- Basic Statistic Mineral production in South Africa 2023, by commodity
- Premium Statistic Financial advisors ranked by M&A transactions value in Russia H1 2020
- Premium Statistic M&A deal share in the food and beverage sector in the GCC by country 2011-2016
- Premium Statistic Mexico: value of metal production 2015-2021
- Basic Statistic Number of M&A transactions in Asia 2015-2017, by country
- Premium Statistic Value of North America's power and utility M&A deals 2016-2018
Related statistics
10
- Basic Statistic Canada's mineral export value 2017, by commodity
- Premium Statistic Number of active mineral exploration sites worldwide by region 2017
- Premium Statistic Distribution of active mineral exploration sites worldwide by region 2017
- Premium Statistic Number and value of iron ore deals worldwide 2012-2014
- Basic Statistic UK mineral production by category 2021
- Premium Statistic BHP revenue 2005-2023
- Premium Statistic BHP's earnings per share 2009-2023
- Premium Statistic BHP's revenue by segment 2023
- Premium Statistic BHP EBITDA 2007-2023
- Premium Statistic YLB's lithium carbonate production in Bolivia 2018-2021
Further related statistics
10
- Coal consumption in South Africa 1998-2022
- Agnico-Eagle Mines' gold reserves 2000-2022
- Financial advisors ranked by M&A transactions in the UK 2022, by deal value
- Primary energy consumption change in China 2000-2022
- Coal consumption volume in China 1998-2022
- Number of employees at Yanzhou Coal Mining 2010-2020
- Glencore's sales of energy products 2010-2023
- Rio Tinto's diamond production 2010-2023
- Iron ore prices 2000-2022
- Leading financial advisors to M&A deals in the UK 2022, by deal volume
Further Content: You might find this interesting as well
Statistics
- Coal consumption in South Africa 1998-2022
- Agnico-Eagle Mines' gold reserves 2000-2022
- Financial advisors ranked by M&A transactions in the UK 2022, by deal value
- Primary energy consumption change in China 2000-2022
- Coal consumption volume in China 1998-2022
- Number of employees at Yanzhou Coal Mining 2010-2020
- Glencore's sales of energy products 2010-2023
- Rio Tinto's diamond production 2010-2023
- Iron ore prices 2000-2022
- Leading financial advisors to M&A deals in the UK 2022, by deal volume
Thomson Reuters. (October 15, 2017). Mining industry merger and acquisition deal value worldwide in 2016 and 2017 by commodity (in million U.S. dollars) [Graph]. In Statista. Retrieved April 18, 2024, from https://www.statista.com/statistics/255704/global-mining-deals-value-by-resource/
Thomson Reuters. "Mining industry merger and acquisition deal value worldwide in 2016 and 2017 by commodity (in million U.S. dollars)." Chart. October 15, 2017. Statista. Accessed April 18, 2024. https://www.statista.com/statistics/255704/global-mining-deals-value-by-resource/
Thomson Reuters. (2017). Mining industry merger and acquisition deal value worldwide in 2016 and 2017 by commodity (in million U.S. dollars). Statista. Statista Inc.. Accessed: April 18, 2024. https://www.statista.com/statistics/255704/global-mining-deals-value-by-resource/
Thomson Reuters. "Mining Industry Merger and Acquisition Deal Value Worldwide in 2016 and 2017 by Commodity (in Million U.S. Dollars)." Statista, Statista Inc., 15 Oct 2017, https://www.statista.com/statistics/255704/global-mining-deals-value-by-resource/
Thomson Reuters, Mining industry merger and acquisition deal value worldwide in 2016 and 2017 by commodity (in million U.S. dollars) Statista, https://www.statista.com/statistics/255704/global-mining-deals-value-by-resource/ (last visited April 18, 2024)
Mining industry merger and acquisition deal value worldwide in 2016 and 2017 by commodity (in million U.S. dollars) [Graph], Thomson Reuters, October 15, 2017. [Online]. Available: https://www.statista.com/statistics/255704/global-mining-deals-value-by-resource/