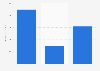
This statistic shows the share of US travelers who were open to their hotel proactively enhacing their stay as of November 2013, with a breakdown by segment. The graph represents the respondents who chose three or four on a scale of one to four, with four being the highest. During the survey, 71 percent of leisure travelers were open to their hotel proactively enhancing their stay.
How open are you to your hotel proactively enhancing your stay?
Basic Account
Get to know the platform
You only have access to basic statistics.
This statistic is not included in your account.
Starter Account
The ideal entry-level account for individual users
- Instant access to 1m statistics
- Download in XLS, PDF & PNG format
- Detailed references
$199 USD / Month *
Professional Account
Full access
Business Solutions including all features.
* Prices do not include sales tax.
Other statistics that may interest you Statistics on
About the industry
9
- Basic Statistic Situations in which U.S. travelers would use smartphones in 2013
- Basic Statistic Average length of stay for Russian travelers in 2013
- Premium Statistic Occupancy rate of TUI AG hotels and resorts 2008-2023, by brand
- Premium Statistic Capacity of TUI AG hotels and resorts 2008-2023, by brand
- Premium Statistic Number of guest nights by foreigners at accommodations in Japan 2022, by region
- Premium Statistic Foreign overnight guest numbers Niseko Japan 2011-2021
- Premium Statistic Number of overnight stays in hotels in the Faroe Islands 2019, by country of origin
- Premium Statistic Important factors for travelers from Sweden when choosing a hotel 2017
- Premium Statistic Share of travelers by platforms they used for accommodation booking 2015, by country
About the region
10
- Premium Statistic Annual change in number of outbound travelers from the U.S. 2002-2022
- Basic Statistic Annual change in number of U.S. residents traveling overseas 2002-2022
- Premium Statistic Share of Millennials in the U.S. who couldn't afford a vacation in 2019
- Premium Statistic Share of Gen X in the U.S. who couldn't afford a vacation in 2019
- Premium Statistic Share of Baby Boomers in the U.S. who couldn't afford vacation in 2019
- Premium Statistic American women's main reasons to travel in 2017
- Premium Statistic Use of emission compensation services by U.S. travelers 2017
- Premium Statistic Types of travel planning children participate in or influence in the U.S. 2014
- Basic Statistic Most offensive habits during family reunion vacations in the U.S. as of June 2014
- Basic Statistic Important accommodation amenities for family reunion vacations in the U.S. in 2014
Selected statistics
10
- Basic Statistic Quarterly average daily rate of hotels in Portland 2016-2017
- Basic Statistic Quarterly average daily rate of hotels in Seattle 2016-2017
- Basic Statistic Quarterly average daily rate of hotels in San Diego 2016-2017
- Basic Statistic Quarterly average daily rate in hotels in Washington D.C. 2016-2017
- Basic Statistic Quarterly average daily rate of hotels in Atlanta 2016-2017
- Basic Statistic Quarterly average daily rate of hotels in Brussels 2010-2017
- Basic Statistic Quarterly average daily rate of hotels in Houston 2016-2017
- Basic Statistic Quarterly average daily rate of hotels in Indianapolis 2016-2017
- Basic Statistic Quarterly average daily rate of hotels in New York 2016-2017
- Basic Statistic Quarterly average daily rate of hotels in Philadelphia 2016-2017
Other regions
10
- Premium Statistic Trips of Italian outbound tourists 2019-2021, by accommodation type
- Premium Statistic Overnight stays of domestic and international visitors in Norway 2019
- Premium Statistic Overnight trips in Northern Ireland 2014-2018, by purpose
- Premium Statistic Lead time between holiday booking and departure in the United Kingdom (UK) 2014-2017
- Basic Statistic Outbound day trips by destination in France 2017
- Basic Statistic Traveler concerns about losing a mobile device while traveling worldwide 2014
- Premium Statistic Colombia: inbound visitors 2012-2019, by purpose of travel
- Premium Statistic Number of domestic overnight stays in Great Britain 2022, by accommodation type
- Premium Statistic Number of trips from Great Britain to Scotland in 2019, by purpose
- Premium Statistic TUI AG employees 2019-2023, by segment
Related statistics
10
- Basic Statistic Most expensive summer vacation rental destinations in the U.S. as of June 2014
- Basic Statistic Cheapest summer vacation rental destinations in the U.S. as of June 2014
- Basic Statistic Type of traveler likely to upgrade rental cars in the U.S. as of May 2014
- Basic Statistic Average gas prices for the Memorial Day holiday period in the U.S. 2010-2022
- Premium Statistic Number of outbound tourists from the U.S. 2002-2022
- Premium Statistic Number of U.S. citizens traveling to Canada 2002-2022
- Premium Statistic Number of U.S. citizens traveling to Mexico 2002-2022
- Basic Statistic Annual change in number of U.S. residents traveling to Canada 2002-2022
- Basic Statistic Annual change in number of U.S. residents traveling to Mexico 2002-2022
- Premium Statistic Average summer vacation travel spend per person in the U.S. 2022
Further related statistics
10
- Number of Royal Caribbean Cruises passenger cruise days worldwide 2007-2023
- Number of Royal Caribbean Cruises available passenger cruise days worldwide 2007-2023
- Revenue share from tourism in India 2013-2022, by segment
- Number of cruises and voyages in Asia 2013-2019
- Number of cruise ships active in Asia 2013-2019, by size category
- Factors affecting accommodation booking worldwide as of July 2016
- Annual revenue of China Tourism Group Duty Free 2013-2023
- Operating income of Royal Caribbean Cruises worldwide 2007-2023
- Number of Marriott International hotels worldwide 2009-2023
- Number of Marriott International hotel rooms worldwide 2009-2023
Further Content: You might find this interesting as well
Statistics
- Number of Royal Caribbean Cruises passenger cruise days worldwide 2007-2023
- Number of Royal Caribbean Cruises available passenger cruise days worldwide 2007-2023
- Revenue share from tourism in India 2013-2022, by segment
- Number of cruises and voyages in Asia 2013-2019
- Number of cruise ships active in Asia 2013-2019, by size category
- Factors affecting accommodation booking worldwide as of July 2016
- Annual revenue of China Tourism Group Duty Free 2013-2023
- Operating income of Royal Caribbean Cruises worldwide 2007-2023
- Number of Marriott International hotels worldwide 2009-2023
- Number of Marriott International hotel rooms worldwide 2009-2023
Magnani Caruso Dutton. (March 5, 2014). How open are you to your hotel proactively enhancing your stay? [Graph]. In Statista. Retrieved April 23, 2024, from https://www.statista.com/statistics/292337/travelers-open-to-hotel-enhancing-their-stay-us/
Magnani Caruso Dutton. "How open are you to your hotel proactively enhancing your stay?." Chart. March 5, 2014. Statista. Accessed April 23, 2024. https://www.statista.com/statistics/292337/travelers-open-to-hotel-enhancing-their-stay-us/
Magnani Caruso Dutton. (2014). How open are you to your hotel proactively enhancing your stay?. Statista. Statista Inc.. Accessed: April 23, 2024. https://www.statista.com/statistics/292337/travelers-open-to-hotel-enhancing-their-stay-us/
Magnani Caruso Dutton. "How Open Are You to Your Hotel Proactively Enhancing Your Stay?." Statista, Statista Inc., 5 Mar 2014, https://www.statista.com/statistics/292337/travelers-open-to-hotel-enhancing-their-stay-us/
Magnani Caruso Dutton, How open are you to your hotel proactively enhancing your stay? Statista, https://www.statista.com/statistics/292337/travelers-open-to-hotel-enhancing-their-stay-us/ (last visited April 23, 2024)
How open are you to your hotel proactively enhancing your stay? [Graph], Magnani Caruso Dutton, March 5, 2014. [Online]. Available: https://www.statista.com/statistics/292337/travelers-open-to-hotel-enhancing-their-stay-us/