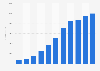
This statistic illustrates the share of Alibaba's mobile revenue from the second quarter of 2012 to the second quarter of 2016. As of the most recently reported quarter, the group's mobile shopping revenue share amounted to 75 percent, up from 51 percent in the corresponding quarter of the previous year.
Mobile share of Alibaba's online shopping revenues from 2nd quarter 2012 to 2nd quarter 2016
Loading statistic...
Basic Account
Get to know the platform
You only have access to basic statistics.
Starter Account
The ideal entry-level account for individual users
- Instant access to 1m statistics
- Download in XLS, PDF & PNG format
- Detailed references
$199 USD / Month *
Professional Account
Full access
Business Solutions including all features.
* Prices do not include sales tax.
Other statistics that may interest you Statistics on
About the industry
10
- Basic Statistic Alibaba: mobile shopping monetization rate 2012-2016
- Basic Statistic Alibaba: mobile share of gross merchandise volume Q2 2012-Q2 2016
- Basic Statistic Alibaba's segment revenue distribution Q4 2023
- Basic Statistic Alibaba's annual segment revenue distribution FY 2019-FY 2023
- Basic Statistic Alibaba: quarterly gross merchandise volume Q2 2012-Q2 2016
- Basic Statistic Taobao: quarterly gross merchandise volume 2012-2016
- Basic Statistic eBay: quarterly gross merchandise volume 2014-2023
- Premium Statistic Pinduoduo's annual revenue 2016-2022
- Premium Statistic Tmall's physical goods GMV growth Q1 2019-Q1 2021
- Basic Statistic Tmall: quarterly gross merchandise volume 2011-2016
About the region
10
- Premium Statistic Pinduoduo's annual gross profit 2016-2022
- Premium Statistic Pinduoduo's number of employees 2016-2022
- Basic Statistic Alibaba's quarterly consolidated revenue Q4 2017-Q4 2023
- Basic Statistic Alibaba's quarterly net income Q4 2017-Q4 2023
- Premium Statistic Pinduoduo's total assets 2016-2022
- Basic Statistic Number of orders placed on Alibaba's platforms on Singles Day 2013-2020
- Premium Statistic Share of luxury fashion brand sales online in China 2014-2017, by platform
- Premium Statistic Share of luxury watch and jewelry sales online in China 2014-2017, by platform
- Basic Statistic Alibaba: share of mobile Singles Day sales 2013-2017
- Premium Statistic Number of Taobao mobile login users 2010-2012
Selected statistics
1
Other regions
10
- Basic Statistic eBay: gross merchandise volume 2007-2022
- Premium Statistic Air pollution news influence on online shopping South Korea 2018, by type
- Premium Statistic Most used marketplaces by e-commerce companies in Italy 2023
- Premium Statistic Share of online shoppers in the CEE region 2023, by country
- Premium Statistic Share of companies with online sales in Finland 2008-2018
- Premium Statistic Share of Canadians that shopped online and offline on a daily/weekly basis 2021
- Premium Statistic Number of registered e-commerce stores in Poland 2013-2023
- Premium Statistic MercadoLibre number of buyers 2012-2019
- Basic Statistic MercadoLibre quarterly revenue in Brazil 2018-2022
- Premium Statistic MercadoLibre revenue in Mexico 2015-2023
Related statistics
10
- Basic Statistic Alibaba's annual revenue FY 2013-FY 2023
- Premium Statistic B2C online retail market platforms' transaction share in China Q3 2022
- Premium Statistic Leading online marketplaces in China 2023, by monthly visits
- Premium Statistic Alibaba: ad spend FY 2014-2023
- Premium Statistic Alibaba's cumulative active online buyers in China Q1 2017-Q1 2022
- Premium Statistic Major international e-commerce platforms in Taiwan 2021
- Premium Statistic Pinduoduo's annual revenue 2017-2022, by segment
- Premium Statistic Retail e-commerce revenue share in total retail revenue in Taiwan 2017-2022
- Premium Statistic E-commerce revenue in Taiwan 2021, by industry
- Premium Statistic E-commerce revenue in Taiwan 2014-2022
Further related statistics
10
- Leading online retailers in Southeast Asia 2020, by monthly visits
- Computer software: Online purchasing in Great Britain 2020, by age group
- Travel arrangements: Online purchasing in Great Britain 2019, by demographic
- Unique visitors to most popular online retailers in India 2014
- Net auction sales of Sotheby's 2009-2019
- Use of smartphones by shoppers in retail stores in Italy in 2015
- Contemporary art lots sold by the leading auction houses worldwide in 2013/2014
- Art auction performance highest hammer prices worldwide 2012
- Global net sales of Monster Beverage 2008-2022
- Baidu's total revenue 2013-2023
Further Content: You might find this interesting as well
Statistics
- Leading online retailers in Southeast Asia 2020, by monthly visits
- Computer software: Online purchasing in Great Britain 2020, by age group
- Travel arrangements: Online purchasing in Great Britain 2019, by demographic
- Unique visitors to most popular online retailers in India 2014
- Net auction sales of Sotheby's 2009-2019
- Use of smartphones by shoppers in retail stores in Italy in 2015
- Contemporary art lots sold by the leading auction houses worldwide in 2013/2014
- Art auction performance highest hammer prices worldwide 2012
- Global net sales of Monster Beverage 2008-2022
- Baidu's total revenue 2013-2023
Alibaba. (August 11, 2016). Mobile share of Alibaba's online shopping revenues from 2nd quarter 2012 to 2nd quarter 2016 [Graph]. In Statista. Retrieved April 19, 2024, from https://www.statista.com/statistics/323082/alibaba-quarterly-mobile-revenue-share/
Alibaba. "Mobile share of Alibaba's online shopping revenues from 2nd quarter 2012 to 2nd quarter 2016." Chart. August 11, 2016. Statista. Accessed April 19, 2024. https://www.statista.com/statistics/323082/alibaba-quarterly-mobile-revenue-share/
Alibaba. (2016). Mobile share of Alibaba's online shopping revenues from 2nd quarter 2012 to 2nd quarter 2016. Statista. Statista Inc.. Accessed: April 19, 2024. https://www.statista.com/statistics/323082/alibaba-quarterly-mobile-revenue-share/
Alibaba. "Mobile Share of Alibaba's Online Shopping Revenues from 2nd Quarter 2012 to 2nd Quarter 2016." Statista, Statista Inc., 11 Aug 2016, https://www.statista.com/statistics/323082/alibaba-quarterly-mobile-revenue-share/
Alibaba, Mobile share of Alibaba's online shopping revenues from 2nd quarter 2012 to 2nd quarter 2016 Statista, https://www.statista.com/statistics/323082/alibaba-quarterly-mobile-revenue-share/ (last visited April 19, 2024)
Mobile share of Alibaba's online shopping revenues from 2nd quarter 2012 to 2nd quarter 2016 [Graph], Alibaba, August 11, 2016. [Online]. Available: https://www.statista.com/statistics/323082/alibaba-quarterly-mobile-revenue-share/