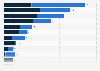
Volume of containers handled by APM terminals 2009-2017
This statistic displays the volume of containers handled by APM (AP Moeller-Maersk) terminals from the fiscal year of 2009 to the fiscal year of 2017. The Danish company handled cargo of nearly 40 million twenty-foot equivalent units in FY 2017.