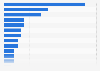
This statistic displays the time spent watching television per weekend day by gender in Northern Ireland in the period from April 2012 to March 2013. During this period, 22 percent of men and 17 percent of women spent over four hours watching television per weekend day.
Total time watching television per weekend day in Northern Ireland in 2013, by gender
Loading statistic...
Basic Account
Get to know the platform
You only have access to basic statistics.
Starter Account
The ideal entry-level account for individual users
- Instant access to 1m statistics
- Download in XLS, PDF & PNG format
- Detailed references
$199 USD / Month *
Professional Account
Full access
Business Solutions including all features.
* Prices do not include sales tax.
Other statistics that may interest you Statistics on
About the industry
4
About the region
10
- Basic Statistic Proportion meeting physical activity guidelines in Northern Ireland 2017, by gender
- Basic Statistic Physical activity: normal/underweight adults in Northern Ireland 2013, by gender
- Basic Statistic Northern Ireland: smoking prevalence in 2022/23, by gender
- Basic Statistic Northern Ireland: e-cigarettes smoking prevalence in 2014-2023
- Premium Statistic Northern Ireland: e-cigarettes smoking prevalence in 2022/23, by age
- Premium Statistic Northern Ireland: e-cigarettes smoking prevalence in 2022/23, by deprivation quintile
- Premium Statistic Northern Ireland: e-cigarettes smoking prevalence in 2022/23, by region
- Basic Statistic Northern Ireland: smoking prevalence 2022/23, by region
- Basic Statistic Use of sunscreen in Northern Ireland 2013, by gender
- Basic Statistic Opinion on who should not use sunbeds in Northern Ireland 2013, by gender
Other regions
10
- Premium Statistic Consumers wearing face sunscreen in Canada 2005-2014, by gender
- Basic Statistic Number of days on which children are physically active in Wales 2018, by gender
- Basic Statistic England: distribution of children who love playing sport 2018, by activity
- Premium Statistic Brazil: people who practice sports 2015, by sports type
- Premium Statistic Birth control methods used by U.S. college students as of fall 2023
- Premium Statistic Chile: physical inactivity 2017, by age
- Basic Statistic Consumption of spirits in the United Kingdom 2000-2012, by in and outside home
- Premium Statistic Share of people going for a work out at least once a week in the Nordics 2019
- Premium Statistic Most popular physical activities Australia 2013/2014 by gender
- Premium Statistic Reasons for doing sports in the Nordic countries 2019
Related statistics
10
- Basic Statistic England: distribution of children 2018, by fondness of playing sport
- Premium Statistic England: distribution of children who love playing sport 2018, by gender
- Premium Statistic England: distribution of children 2018, by gender and liking of being active
- Basic Statistic England: share of children who know how to get involved in sport 2018, by ethnicity
- Basic Statistic England: share of children who understand why sport is good 2018, by school year
- Basic Statistic England: share of children who understand why sport is good 2018, by by ethnicity
- Basic Statistic England: distribution of boys and girls 2018, by liking of playing sport
- Basic Statistic Weekly amount of physical activity in Wales 2020, by gender
- Basic Statistic NI: share of households who skipped a substantial meal day in past fortnight 2017/18
- Basic Statistic Northern Ireland: people eating less than 5 fruit or vegetable portions a day 2010-20
Further related statistics
10
- Overweight prevalence in England 2000-2021, by gender
- Consumer rating of impact of type of calories on weight gain 2013-2021
- Information foods/beverages package influence on purchase 2013-2016
- Presence of mental ill health in England 2014, by gender
- Leading causes of death among the white population in the United States in 2020
- U.S. population without health care visits 1997-2018, by gender
- Adults with severe headache or migraine 1997-2016, by gender
- Food items adults eat more of when trying to be healthier in Great Britain 2017
- Weight management strategies believed to be most effective 2016
- Consideration of the healthfulness of food and beverages by U.S. consumers 2013-2015
Further Content: You might find this interesting as well
Statistics
- Overweight prevalence in England 2000-2021, by gender
- Consumer rating of impact of type of calories on weight gain 2013-2021
- Information foods/beverages package influence on purchase 2013-2016
- Presence of mental ill health in England 2014, by gender
- Leading causes of death among the white population in the United States in 2020
- U.S. population without health care visits 1997-2018, by gender
- Adults with severe headache or migraine 1997-2016, by gender
- Food items adults eat more of when trying to be healthier in Great Britain 2017
- Weight management strategies believed to be most effective 2016
- Consideration of the healthfulness of food and beverages by U.S. consumers 2013-2015
NISRA. (March 21, 2014). Total time watching television per weekend day in Northern Ireland in 2013, by gender [Graph]. In Statista. Retrieved April 25, 2024, from https://www.statista.com/statistics/368381/television-time-weekend-day-by-gender-in-northern-ireland/
NISRA. "Total time watching television per weekend day in Northern Ireland in 2013, by gender." Chart. March 21, 2014. Statista. Accessed April 25, 2024. https://www.statista.com/statistics/368381/television-time-weekend-day-by-gender-in-northern-ireland/
NISRA. (2014). Total time watching television per weekend day in Northern Ireland in 2013, by gender. Statista. Statista Inc.. Accessed: April 25, 2024. https://www.statista.com/statistics/368381/television-time-weekend-day-by-gender-in-northern-ireland/
NISRA. "Total Time Watching Television per Weekend Day in Northern Ireland in 2013, by Gender." Statista, Statista Inc., 21 Mar 2014, https://www.statista.com/statistics/368381/television-time-weekend-day-by-gender-in-northern-ireland/
NISRA, Total time watching television per weekend day in Northern Ireland in 2013, by gender Statista, https://www.statista.com/statistics/368381/television-time-weekend-day-by-gender-in-northern-ireland/ (last visited April 25, 2024)
Total time watching television per weekend day in Northern Ireland in 2013, by gender [Graph], NISRA, March 21, 2014. [Online]. Available: https://www.statista.com/statistics/368381/television-time-weekend-day-by-gender-in-northern-ireland/