- Internet›
- Social Media & User-Generated Content›
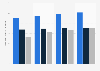
Share of U.S. teenagers who use Vine 2015, by ethnicity
Percentage of teenagers in the United States who use Vine as of March 2015, by ethnicity

Percentage of teenagers in the United States who use Vine as of March 2015, by ethnicity
Share of respondents | |
---|---|
White, non-Hispanic | 22% |
Black, non-Hispanic | 31% |
Hispanic | 24% |
Share of respondents | |
---|---|
White, non-Hispanic | 22% |
Black, non-Hispanic | 31% |
Hispanic | 24% |
© Statista 2019
About this statistic
Show source
Please be patient - this may take a moment
Description
Source
More information
- Show sources information
- Show publisher information
- Release date
- April 2015
- Region
- United States
- Survey time period
- September 25 to October 9, 2014 and February 10 to March 16, 2015
- Number of respondents
- 1,060 respondents
- Age group
- 13 to 17 years
- Method of interview
- Online survey
Source
- Show sources information
- Show publisher information
- Release date
- April 2015
More information
- Region
- United States
- Survey time period
- September 25 to October 9, 2014 and February 10 to March 16, 2015
- Number of respondents
- 1,060 respondents
- Age group
- 13 to 17 years
- Method of interview
- Online survey
Other statistics on the topic

Mobile Internet & Apps
Most popular social media apps in the U.S. 2019, by audience

Social Media & User-Generated Content
Favorite social networks of U.S. teens 2012-2019

Mobile Internet & Apps
Most popular social media apps in the U.S. 2019, by reach

Mobile Internet & Apps
Leading mobile messengers in the U.S. 2019, by users
You only have access to basic statistics.
- Instant access to 1m statistics
- Download in XLS, PDF & PNG format
- Detailed references
$59 / Month *
Corporate solution including all features.
Prices do not include sales tax.


I think of Statista as Google for researchers. Statista provides you with the information you search for right away.Dr. Horst Stipp
EVP, Research & Innovation, Advertising Research Foundation
- Overview
- Media usage in an internet minute as of March 2019Media usage in an online minute 2019
- Global mobile social network penetration rate as of January 2019, by regionGlobal mobile social penetration rate 2019, by region
- Social media share of mobile visits in the United States from 1st quarter 2018 to 3rd quarter 2019U.S. social media mobile visits share 2017-2019
- Mobile share of social media visits in the United States from 4th quarter 2017 to 3rd quarter 2019Mobile share of U.S. social media visits 2017-2019
- Average daily time spent on selected social networks by users in the United States from 2014 to 2021 (in minutes)Average daily time spent on leading social networks by U.S. users 2021
- Average time spent per day on selected digital activities by adult users in the United States from 2016 to 2020 (in minutes)Daily U.S. adult user time spent on digital media 2016-2020
- Market leaders
- Mobile audience reach of leading smartphone apps in the United States as of August 2019Reach of most popular U.S. smartphone apps 2019
- Market reach of the most popular mobile app categories in the United States as of September 2019Leading mobile app categories in the United States 2019, by reach
- Year-on-year change in user engagement with selected social media apps in the United States as of December 2018U.S. mobile social app user engagement growth 2018
- Leading Android apps in the Google Play Store in the United States as of June 2019, by number of downloads (in millions)Leading Android apps in the U.S. 2019, by downloads
- Leading social networking apps in the Apple App Store in the United States in June 2019, by number of downloadsLeading iPhone social networking apps in the U.S. 2019, by downloads
- Leading social networking apps in the Apple App Store in the United States in June 2019, by revenue (in million U.S. dollars)Leading iPhone social networking apps in the U.S. 2019, by revenue
- Most popular mobile social networking apps in the United States as of September 2019, by monthly users (in millions)Most popular social media apps in the U.S. 2019, by audience
- Most popular mobile social networking apps in the United States as of September 2019, by reachMost popular social media apps in the U.S. 2019, by reach
- Mobile messaging
- Most popular mobile messaging apps in the United States as of September 2019, by monthly active users (in millions)Leading mobile messengers in the U.S. 2019, by users
- Most popular mobile messaging apps in the United States as of September 2019, by mobile reachLeading mobile messengers in the U.S. 2019, by reach
- Most popular mobile messaging apps in the United States as of September 2019, by user engagement (in minutes per month)Leading mobile messengers in the U.S. 2019, by monthly usage
- Most popular mobile messaging apps in the United States as of September 2019, by usage sessionsLeading mobile messengers in the U.S. 2019, by monthly sessions
- Most popular mobile messaging apps in the United States as of September 2019, by average session duration (in minutes)Leading mobile messengers in the U.S. 2019, by session duration
- Most popular dark social channels for internet users from the United States and the UK to typically share information or content with peers as of 1st quarter 2019U.S. & UK top dark social channels for content and information sharing 2019
- Most used mobile messaging features according to adults in the United States in 2018Top mobile messaging features by U.S. adults 2018
- Number of messaging services used by adults in the United States in the past month in 2018Number of messaging services used by U.S. adults in the past month 2018
- Activities
- Social media activities on select social networks by social media users in the United States in February 2019U.S. social media activities 2019, by platform
- Daily engagement rate of selected mobile social media apps among Android users in the United States as of August 2019Daily engagement rate of U.S. mobile social users 2019
- Frequency of leading mobile phone activities among internet users in the United States as of June 2018Most popular smartphone activities in the United States 2018, by frequency
- Leading reasons why teenagers in the United States feel that social media has a mostly positive effect on people their own age as of April 2018Teen perspectives on positive effects of social media in the U.S. 2018
- Share of consumers in the United States who use a second screen for selected activities during TV consumption as of fall 2017Second screen activities of U.S. users while watching TV 2017
- Frequency of using social media via smartphone while watching TV on a separate device according to adult users in the United States as of January 2019Frequency of U.S. smartphone social usage while watching TV 2019
- Share of internet users in the United States who are interested in purchasing products through social media as of August 2019, by age groupU.S. interest in purchasing items via social commerce 2019, by age group
- Online environments where cyber bullying victims in the United States have been harassed as of December 2018U.S. cyber bullying environments 2018
- Number of Instagram users in the United States from 2017 to 2023 (in millions)Instagram: number of users in the United States 2017-2023
- Percentage of U.S. adults who use Instagram as of February 2019, by genderInstagram usage reach in the United States 2019, by gender
- Percentage of U.S. adults who use Instagram as of February 2019, by age groupInstagram usage reach in the United States 2019, by age group
- Percentage of U.S. adults who use Instagram as of February 2019, by educational backgroundInstagram usage reach in the United States 2019, by education
- Leading brands in the United States on Instagram in 2018, based on user engagement (in million actions)Leading U.S. brands on Instagram 2018, by user engagement
- Fastest-growing influencers on Instagram in the United States as of September 2019, based on follower growth in the past 4 weeksFastest-growing Instagram influencers in the U.S. 2019
- Most-followed food influencers on Instagram in the United States as of September 2019Most popular food influencers on Instagram in the U.S. 2019
- Most-followed travel influencers on Instagram in the United States as of September 2019Most popular travel influencers on Instagram in the U.S. 2019
- Snapchat
- Distribution of Snapchat users in the United States as of July 2019, by genderSnapchat user ratio in the U.S. 2019, by gender
- Distribution of Snapchat users in the United States as of July 2019, by age groupSnapchat user ratio in the U.S. 2019, by age group
- Distribution of Snapchat users in the United States as of July 2019, by age group and genderSnapchat user ratio in the U.S. 2019, by age group & gender
- Distribution of Snapchat users in the United States as of July 2019, by usage frequencySnapchat user ratio in the U.S. 2019, by frequency
- Share of active Snapchat users in the United States as of July 2019Rate of Snapchat user activity in the U.S. 2019
- Share of U.S. teenagers who use Vine 2015, by gender and age
- Share of U.S. teenagers who use Vine 2015, by age
- Share of U.S. teenagers who use Vine 2015, by gender
- Share of U.S. teenagers who use Snapchat 2015, by gender and age
- Weekly average time spent on SNS South Korea 2018
- Italy: share of companies doing storytelling on Facebook 2017, by type
- Social network audiences in the United States 2015
- Share of U.S. teenagers who use Instagram 2015, by gender and age
- Arab WhatsApp penetration 2014
- Share of U.S. teenagers who use Facebook 2015, by gender and age
- Pinterest: U.S. user distribution 2013-2019, by gender
- Global tablet social network penetration 2014, by region
- Americas: Twitter visitor reach 2015
- SEA reach of leading mobile messengers 2015
- Vine accounts with the most followers worldwide 2017
- Media used for professional networking in the United Kingdom (UK) 2014
- Austria: online video sources 2015
- France: online video sources 2015
- Media usage in an online minute 2019
- Global mobile social penetration rate 2019, by region
- U.S. social media mobile visits share 2017-2019
- Mobile share of U.S. social media visits 2017-2019
- Average daily time spent on leading social networks by U.S. users 2021
- Daily U.S. adult user time spent on digital media 2016-2020
- Reach of most popular U.S. smartphone apps 2019
- Leading mobile app categories in the United States 2019, by reach
- U.S. mobile social app user engagement growth 2018
- Leading Android apps in the U.S. 2019, by downloads
- Leading iPhone social networking apps in the U.S. 2019, by downloads
- Leading iPhone social networking apps in the U.S. 2019, by revenue
- Most popular social media apps in the U.S. 2019, by audience
- Most popular social media apps in the U.S. 2019, by reach
- Most popular social media apps in the U.S. 2019, by engagement
- Most popular social media apps in the U.S. 2019, by monthly sessions
- Most popular social media apps in the U.S. 2019, by session length
- Most popular mobile-only social networks in the U.S. 2018
- Favorite social networks of U.S. teens 2012-2019
- U.S. teens: social networks and app daily reach 2019
- Leading mobile messengers in the U.S. 2019, by users
- Leading mobile messengers in the U.S. 2019, by reach
- Leading mobile messengers in the U.S. 2019, by monthly usage
- Leading mobile messengers in the U.S. 2019, by monthly sessions
- Leading mobile messengers in the U.S. 2019, by session duration
- U.S. & UK top dark social channels for content and information sharing 2019
- Top mobile messaging features by U.S. adults 2018
- Number of messaging services used by U.S. adults in the past month 2018
- U.S. social media activities 2019, by platform
- Daily engagement rate of U.S. mobile social users 2019
- Most popular smartphone activities in the United States 2018, by frequency
- Teen perspectives on positive effects of social media in the U.S. 2018
- Second screen activities of U.S. users while watching TV 2017
- Frequency of U.S. smartphone social usage while watching TV 2019
- U.S. interest in purchasing items via social commerce 2019, by age group
- U.S. cyber bullying environments 2018
- Instagram: number of users in the United States 2017-2023
- Instagram usage reach in the United States 2019, by gender
- Instagram usage reach in the United States 2019, by age group
- Instagram usage reach in the United States 2019, by education
- Leading U.S. brands on Instagram 2018, by user engagement
- Fastest-growing Instagram influencers in the U.S. 2019
- Most popular food influencers on Instagram in the U.S. 2019
- Most popular travel influencers on Instagram in the U.S. 2019
- Most popular fashion & beauty influencers on Instagram in the U.S. 2019
- Share of U.S. teenagers who use Vine 2015, by gender and age
- Share of U.S. teenagers who use Vine 2015, by age
- Share of U.S. teenagers who use Vine 2015, by gender
- Share of U.S. teenagers who use Snapchat 2015, by gender and age
- Weekly average time spent on SNS South Korea 2018
- Italy: share of companies doing storytelling on Facebook 2017, by type
- Social network audiences in the United States 2015
- Share of U.S. teenagers who use Instagram 2015, by gender and age
- Arab WhatsApp penetration 2014
- Share of U.S. teenagers who use Facebook 2015, by gender and age
- Pinterest: U.S. user distribution 2013-2019, by gender
- Global tablet social network penetration 2014, by region
- Americas: Twitter visitor reach 2015
- SEA reach of leading mobile messengers 2015
- Vine accounts with the most followers worldwide 2017
- Media used for professional networking in the United Kingdom (UK) 2014
- Austria: online video sources 2015
- France: online video sources 2015
Statista offers dossiers and reports on over 170 industries. With Statista you are always able to make informed decisions and boost your work efficiency.
- Social Media
- E-Commerce
- Online Video & Entertainment
- Advertising & Marketing
- Alcoholic Beverages
- Cleaning Products
- Cosmetics & Personal Care
- Food & Nutrition
- Health & Hygiene
- International Trade
- Shopping Behavior
- Sports & Leisure
- Business Travel
- Leisure Travel
- Accomodation
- Restaurants
- Demographics
- Economy
- Education & Science
- Politics & Government
- Aviation
- Rail Transport
- Vehicles & Road Traffic
- Water Transport
Register in seconds and access exclusive features.
Basic Account
|
Instant Access
Premium Account
| ||
---|---|---|---|
Our services
Click the question mark for further information | Free |
$59 per month*
| |
Basic statistics | |||
Premium statistics | |||
Graph download
| |||
Download PDF | |||
Excel download
| |||
Register | Purchase now |
This feature is limited to our corporate solutions.
Please contact us to get started with full access to dossiers, forecasts, studies and international data.
We use cookies to personalize contents and ads, offer social media features, and analyze access to our website. In your browser settings you can configure or disable this, respectively, and can delete any already placed cookies. For details, please see your browser’s Help section (by pressing F1). Please see our privacy statement for details about how we use data.