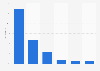
This statistic presents the preferred in-store purchase methods of online shoppers in Japan as of October 2014. During the survey period, it was found that 86 percent of online shoppers prefer a purchase through an associate at a checkout counter in-store.
Preferred in-store purchase methods of online shoppers in Japan as of October 2014
Basic Account
Get to know the platform
You only have access to basic statistics.
This statistic is not included in your account.
Starter Account
The ideal entry-level account for individual users
- Instant access to 1m statistics
- Download in XLS, PDF & PNG format
- Detailed references
$199 USD / Month *
Professional Account
Full access
Business Solutions including all features.
* Prices do not include sales tax.
Other statistics that may interest you Statistics on
About the industry
10
- Basic Statistic UK: share of individuals that preferred to receive e-receipts in-store 2015, by age
- Premium Statistic Asia: appealing shopping conveniences 2014
- Premium Statistic Asia: in-store smartphone shopping activities 2014
- Premium Statistic E-commerce penetration rate in Latin America 2021, by country
- Premium Statistic Global consumer interest in retail technologies as of 2019
- Premium Statistic Use of smartphones by shoppers in retail stores in Europe in 2015
- Premium Statistic U.S. retail e-commerce sales CAGR 2017-2027, by product category
- Premium Statistic UK: leading weekly e-commerce activities 2023, by category
- Premium Statistic Most used sales channel among global consumers as of 2019
- Premium Statistic Favored cashless payment option when online shopping among global consumers 2019
About the region
10
- Premium Statistic Japan: device used for online purchase 2015
- Premium Statistic Average daily mobile device usage of Japanese parents and teens 2017
- Premium Statistic Average daily mobile device use Japanese parent and teens 2017, by activity
- Premium Statistic Average daily mobile device use Japanese teens 2017, by activity and gender
- Premium Statistic Japanese teens' attitude mobile device 2017
- Premium Statistic Mobile content related market size Japan 2013-2022
- Premium Statistic Most installed smartphone apps in Japan 2021, by category
- Premium Statistic Dating app user share Japan 2020
- Premium Statistic Leading dating apps in Japan 2020, by gender
- Premium Statistic Duration of dating app user experiences in Japan 2019, by gender
Other regions
10
- Basic Statistic Mexico: Buen Fin online purchasing share 2019, by device
- Premium Statistic Brazil: retail website unique visitor share by device 2019
- Premium Statistic U.S. online shopper conversion rate 2021-2022, by device
- Premium Statistic Vietnam: device used for online purchase 2015
- Premium Statistic Hungary: device used for online purchase 2015
- Premium Statistic Malaysia: device used for online purchase 2015
- Premium Statistic Canada: device used for online purchase 2015
- Premium Statistic Israel: device used for online purchase 2015
- Premium Statistic Hong Kong: device used for online purchase 2015
- Premium Statistic Greece: device used for online purchase 2015
Related statistics
10
- Premium Statistic Leading drivers for customer satisfaction Japan 2017
- Premium Statistic Online shopping behavior since COVID-19 pandemic in Japan 2023
- Premium Statistic Total assets of major retailers in Japan 2022
- Premium Statistic Total assets of major Japanese food manufacturers 2021
- Premium Statistic Monthly retail sales value in Japan 2018-2022
- Premium Statistic Weekly e-commerce activity share in Japan Q3 2023
- Premium Statistic Average small-city household monthly online expenditure in Japan 2023, by product
- Premium Statistic Average town or village household monthly online spending in Japan 2023, by product
- Premium Statistic Monthly average household food expenses in Japan 2023, by type
- Premium Statistic Average monthly household expenditure on online purchases in Japan 2023, by product
Further related statistics
10
- Number of China Unicom mobile subscriptions 2012-2022
- Use of mobile devices to make restaurant reservations in the U.S. 2014, by age group
- BlackBerry net income/loss 2009-2023
- LG Electronics revenue by segment 2016-2023, by quarter
- U.S. mobile wireless MOUs 2005-2021
- Number of AT&T of connected device subscribers 2009-2023
- Consumer electronics: Online purchasing in Great Britain 2020, by demographic
- Smartphone adoption in the United Kingdom (UK) 2011-2018
- Channels consumers use for their main grocery shop in the United Kingdom (UK) 2013
- Furniture shopping: Consumers' delivery preferences in the United Kingdom (UK) 2013
Further Content: You might find this interesting as well
Statistics
- Number of China Unicom mobile subscriptions 2012-2022
- Use of mobile devices to make restaurant reservations in the U.S. 2014, by age group
- BlackBerry net income/loss 2009-2023
- LG Electronics revenue by segment 2016-2023, by quarter
- U.S. mobile wireless MOUs 2005-2021
- Number of AT&T of connected device subscribers 2009-2023
- Consumer electronics: Online purchasing in Great Britain 2020, by demographic
- Smartphone adoption in the United Kingdom (UK) 2011-2018
- Channels consumers use for their main grocery shop in the United Kingdom (UK) 2013
- Furniture shopping: Consumers' delivery preferences in the United Kingdom (UK) 2013
comScore. (March 3, 2015). Preferred in-store purchase methods of online shoppers in Japan as of October 2014 [Graph]. In Statista. Retrieved April 25, 2024, from https://www.statista.com/statistics/440581/instore-purchase-methods-preference-japan/
comScore. "Preferred in-store purchase methods of online shoppers in Japan as of October 2014." Chart. March 3, 2015. Statista. Accessed April 25, 2024. https://www.statista.com/statistics/440581/instore-purchase-methods-preference-japan/
comScore. (2015). Preferred in-store purchase methods of online shoppers in Japan as of October 2014. Statista. Statista Inc.. Accessed: April 25, 2024. https://www.statista.com/statistics/440581/instore-purchase-methods-preference-japan/
comScore. "Preferred In-store Purchase Methods of Online Shoppers in Japan as of October 2014." Statista, Statista Inc., 3 Mar 2015, https://www.statista.com/statistics/440581/instore-purchase-methods-preference-japan/
comScore, Preferred in-store purchase methods of online shoppers in Japan as of October 2014 Statista, https://www.statista.com/statistics/440581/instore-purchase-methods-preference-japan/ (last visited April 25, 2024)
Preferred in-store purchase methods of online shoppers in Japan as of October 2014 [Graph], comScore, March 3, 2015. [Online]. Available: https://www.statista.com/statistics/440581/instore-purchase-methods-preference-japan/