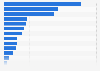
Leading inbound travel markets in Austria 2018, by arrivals
This statistic shows the leading international markets visiting in Austria in 2018, by number of arrivals. Germany was at the top of the list, with approximately 14 million arrivals, followed by the Netherlands, Switzerland and Liechtenstein.