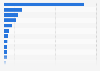
Video content watched in the U.S. 2017

Share of adults watching selected types of TV, video and film content in the United States in 2017

Download
Show detailed source information?
Register for free
Already a member?
Log in
Source

Use Ask Statista Research Service

Release date

December 2017

Region

United States

Survey time period

2017

Number of respondents

1,000 respondents

Age group

18 years and older

Supplementary notes

During the survey, this question was posed as follows: "Which of the following types of content do you watch?"

Citation formats
Statista Accounts: Access All Statistics. Starting from $2,388 USD / Year
Basic Account
Get to know the platform

You only have access to basic statistics.
This statistic is not included in your account.

Starter Account
The ideal entry-level account for individual users
  • Instant access to 1m statistics
  • Download in XLS, PDF & PNG format
  • Detailed references
$199 USD / Month *
Professional Account
Full access

Business Solutions including all features.

* Prices do not include sales tax.

Statistics on " Online mass media in the U.S. "

Other statistics that may interest you Online mass media in the U.S.

Television

8

Radio

7

Newspapers

7

Magazines

8

Further related statistics

17
Statista Accounts: Access All Statistics. Starting from $2,388 USD / Year
Learn more about how Statista can support your business.