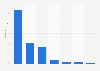
In 2019, the North-West was the Italian macro-region recording the highest number of stage shows. Overall, this area hosted nearly 34 thousand events of this type. The Center ranked second on the list, as it organized about 32.8 thousand performances.
Number of stage shows in Italy in 2019, by macro-region
Basic Account
Get to know the platform
You only have access to basic statistics.
This statistic is not included in your account.
Starter Account
The ideal entry-level account for individual users
- Instant access to 1m statistics
- Download in XLS, PDF & PNG format
- Detailed references
$199 USD / Month *
Professional Account
Full access
Business Solutions including all features.
* Prices do not include sales tax.
Other statistics that may interest you Statistics on
About the industry
10
- Premium Statistic Attendance at theater shows in Italy 2019-2022, by segment
- Premium Statistic Box office and audience expenditure at stage shows in Italy 2019, by region
- Premium Statistic Revenue of stage shows in Italy 2019, by region
- Premium Statistic Number of performances at theaters in Denmark 2018/19, by genre
- Premium Statistic Attendance at opera and ballet shows in Turkey 2000-2022
- Basic Statistic Total number of performances in the Netherlands 2008-2020
- Premium Statistic Revenue of entertainment events in Italy 2019, by month
- Premium Statistic Stage shows' revenue, box office, and audience spending in Italy 2019, by sector
- Premium Statistic Income per entertainment venue in Italy 2010-2019
- Premium Statistic Number of productions at Danish theaters 2018/19, by genre
About the region
10
- Premium Statistic Attendance at dance and entertainment events in Italy 2019-2022, by segment
- Premium Statistic Attendance at entertainment events in Italy 2019-2022, by segment
- Premium Statistic Key information on the entertainment industry in Italy 2019-2022
- Premium Statistic Monthly attendance at entertainment events in Italy 2019-2022
- Premium Statistic Entertainment venues in the Italia region of Lazio 2020, by type
- Premium Statistic Entertainment venues in the Italian region of Sicily 2020, by type
- Basic Statistic Entertainment events in Italy 2019-2020, by macro-region
- Premium Statistic Entertainment venues in Italy 2010-2020
- Premium Statistic Stage shows in Italy 2011-2020
- Premium Statistic Box office and audience spending at entertainment events in Italy 2019-2020, by month
Selected statistics
9
- Basic Statistic Not-for-profit theaters' aggregate number of performances in the U.S. 2018-2022
- Basic Statistic Not-for-profit theaters' average contributed income in the U.S. 2018-2022
- Premium Statistic Attendance at U.S. nonprofit professional theatres 2002-2013
- Premium Statistic Workforce of not-for-profit theaters in the U.S. 2009-2022
- Basic Statistic Not-for-profit theaters earned income via single ticket sales in the U.S. 2018-2022
- Premium Statistic Not-for-profit theaters average working capital in the U.S. 2016-2020
- Basic Statistic Not-for-profit theatres average single ticket price in the U.S. 2015-2019
- Basic Statistic Number of degrees in visual and performing arts in the U.S. 1999-2013
- Premium Statistic Motivations for attending theater performances in the U.S. 2012
Other regions
10
- Premium Statistic Visitor numbers to the Amsterdam Dance Event (ADE) 2011-2019
- Premium Statistic Performing arts attendance, by performance type U.S. 2017
- Premium Statistic Number of tickets sold in the live performance sector Australia 2018, by category
- Premium Statistic Attendance at theater shows in Turkey 2000-2019
- Basic Statistic Europe: share of people who have danced in the past 12 months in 2013, by country
- Premium Statistic Number of theatre productions in the United Kingdom (UK) 2014, by genre
- Premium Statistic Frequency of visiting dance shows and events in Scotland in 2017
- Premium Statistic Brazil: most popular sports disciplines 2015
- Basic Statistic Children (5-10): participation in the arts in England 2020. by activity
- Premium Statistic Number of private theatres in Germany 2009-2019
Related statistics
10
- Premium Statistic Visual arts attendance, by location U.S. 2017
- Basic Statistic Attendance at performing arts events in the U.S. 2003-2013
- Basic Statistic Revenue of the performing arts industry in the Netherlands 2016-2021, by type
- Basic Statistic Total grants assigned to the performing arts industry in the Netherlands 2008-2021
- Basic Statistic Total visits to performances in the Netherlands 2008-2021
- Basic Statistic Visits to performances in the Netherlands 2015-2021, by type
- Basic Statistic Not-for-profit theaters' distribution of expenses in the U.S. 2018-2022
- Premium Statistic Leading fee-based festivals in the Netherlands 2019, by number of visitors
- Premium Statistic Leading free festivals in the Netherlands 2019, by number of visitors
- Premium Statistic Number of festivals in the Netherlands 2012-2023
Further related statistics
10
- Most visited art museums worldwide 2019-2023
- Membership in the American Guild of Musical Artists in the U.S. 2000-2013
- Number of independent artists, writers and performers in the U.S. 2000-2013
- Consumer expenditure on live entertainment in the U.S. 1999-2013
- Consumer expenditure on photo studios in the U.S. 1999-2013
- Popular music concerts: total attendance in the U.S. 2003-2013
- Average wage in artistic occupations in the U.S. 1999-2013
- Contemporary art lots sold by the leading auction houses worldwide in 2013/2014
- Number of people participating in personal creativity activities in the U.S. 2010
- Q-Cells: production by segment
Further Content: You might find this interesting as well
Statistics
- Most visited art museums worldwide 2019-2023
- Membership in the American Guild of Musical Artists in the U.S. 2000-2013
- Number of independent artists, writers and performers in the U.S. 2000-2013
- Consumer expenditure on live entertainment in the U.S. 1999-2013
- Consumer expenditure on photo studios in the U.S. 1999-2013
- Popular music concerts: total attendance in the U.S. 2003-2013
- Average wage in artistic occupations in the U.S. 1999-2013
- Contemporary art lots sold by the leading auction houses worldwide in 2013/2014
- Number of people participating in personal creativity activities in the U.S. 2010
- Q-Cells: production by segment
Italian Society of Authors and Publishers. (November 15, 2020). Number of stage shows in Italy in 2019, by macro-region [Graph]. In Statista. Retrieved April 20, 2024, from https://www.statista.com/statistics/548440/number-of-theatre-activities-in-italy-by-macro-region/
Italian Society of Authors and Publishers. "Number of stage shows in Italy in 2019, by macro-region." Chart. November 15, 2020. Statista. Accessed April 20, 2024. https://www.statista.com/statistics/548440/number-of-theatre-activities-in-italy-by-macro-region/
Italian Society of Authors and Publishers. (2020). Number of stage shows in Italy in 2019, by macro-region. Statista. Statista Inc.. Accessed: April 20, 2024. https://www.statista.com/statistics/548440/number-of-theatre-activities-in-italy-by-macro-region/
Italian Society of Authors and Publishers. "Number of Stage Shows in Italy in 2019, by Macro-region." Statista, Statista Inc., 15 Nov 2020, https://www.statista.com/statistics/548440/number-of-theatre-activities-in-italy-by-macro-region/
Italian Society of Authors and Publishers, Number of stage shows in Italy in 2019, by macro-region Statista, https://www.statista.com/statistics/548440/number-of-theatre-activities-in-italy-by-macro-region/ (last visited April 20, 2024)
Number of stage shows in Italy in 2019, by macro-region [Graph], Italian Society of Authors and Publishers, November 15, 2020. [Online]. Available: https://www.statista.com/statistics/548440/number-of-theatre-activities-in-italy-by-macro-region/