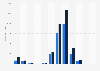
The statistic presents the touring attractions box office and audience expenditures in Italy in 2018, by macro-region. Events taking place in the Southern part of Italy had the highest expenditure: about 3.3 million euros of box office expenditure and roughly 4.8 million euros of audience expenditure.
Touring attractions box office and audience expenditure in Italy in 2018, by macro-region (in euros)
Basic Account
Get to know the platform
You only have access to basic statistics.
This statistic is not included in your account.
Starter Account
The ideal entry-level account for individual users
- Instant access to 1m statistics
- Download in XLS, PDF & PNG format
- Detailed references
$199 USD / Month *
Professional Account
Full access
Business Solutions including all features.
* Prices do not include sales tax.
Other statistics that may interest you Statistics on
About the industry
1
About the region
10
- Premium Statistic Audience expenditure of jazz music concerts in Italy 2013-2020
- Premium Statistic Revenue of revue and musical events in Italy 2013-2019
- Premium Statistic Jazz music shows revenue in Italy 2013-2019
- Premium Statistic Box office and audience expenditure at dance events in Italy 2019, by month
- Basic Statistic Circus venues in Italy 2018, by region
- Premium Statistic Box office and audience expenditure of soccer events in Italy 2018, by region
- Premium Statistic Box office of soccer events in Italy 2018, by macro-region
- Premium Statistic Top 10 pop music concerts in Italy 2020, by number of entrances
- Premium Statistic Box office expenditure at theatre events in Italy 2019-2020, by month
- Basic Statistic Box office expenditure at ballet shows in Italy 2020, by region
Other regions
9
- Premium Statistic Number of tickets sold to the Helsinki Festival in Finland 2015-2022
- Premium Statistic Buying and reselling tickets for events in Great Britain 2014
- Premium Statistic Total performing arts activities Singapore 2012-2019 by entry type
- Premium Statistic Audience of concerts in Denmark 2018, by organizer
- Premium Statistic Israel: revenue breakdown of top tier football clubs 2015-2018, by source
- Premium Statistic Ukraine: revenue breakdown of top tier football clubs 2015-2018, by source
- Premium Statistic Belarus: revenue breakdown of top tier football clubs 2015-18, by source
- Premium Statistic Scotland: revenue breakdown of top tier football clubs 2015-2018, by source
- Premium Statistic Slovenia: revenue breakdown of top tier football clubs 2015-2018, by source
Related statistics
8
- Premium Statistic Admissions and attendance at touring amusement activities in Italy 2020, by sector
- Premium Statistic Box office and audience expenditure of amusement parks in Italy 2020, by month
- Premium Statistic Audience expenditure at amusements parks in Italy 2013-2020
- Premium Statistic Visitor numbers to the Tilburgse Kermis in the Netherlands 2011-2018
- Premium Statistic Number of conventions held in Las Vegas 2001-2017
- Basic Statistic Share of women practicing nudism at the beach in France 2017, by geographical zone
- Basic Statistic Distribution of women practicing naturism in the world 2017, by country
- Basic Statistic Share of hospitality & tourism businesses in the UK in 2012, by employment size
Further Content: You might find this interesting as well
Italian Society of Authors and Publishers. (July 1, 2019). Touring attractions box office and audience expenditure in Italy in 2018, by macro-region (in euros) [Graph]. In Statista. Retrieved April 20, 2024, from https://www.statista.com/statistics/551281/touring-attractions-box-office-in-italy-by-macro-region/
Italian Society of Authors and Publishers. "Touring attractions box office and audience expenditure in Italy in 2018, by macro-region (in euros)." Chart. July 1, 2019. Statista. Accessed April 20, 2024. https://www.statista.com/statistics/551281/touring-attractions-box-office-in-italy-by-macro-region/
Italian Society of Authors and Publishers. (2019). Touring attractions box office and audience expenditure in Italy in 2018, by macro-region (in euros). Statista. Statista Inc.. Accessed: April 20, 2024. https://www.statista.com/statistics/551281/touring-attractions-box-office-in-italy-by-macro-region/
Italian Society of Authors and Publishers. "Touring Attractions Box Office and Audience Expenditure in Italy in 2018, by Macro-region (in Euros)." Statista, Statista Inc., 1 Jul 2019, https://www.statista.com/statistics/551281/touring-attractions-box-office-in-italy-by-macro-region/
Italian Society of Authors and Publishers, Touring attractions box office and audience expenditure in Italy in 2018, by macro-region (in euros) Statista, https://www.statista.com/statistics/551281/touring-attractions-box-office-in-italy-by-macro-region/ (last visited April 20, 2024)
Touring attractions box office and audience expenditure in Italy in 2018, by macro-region (in euros) [Graph], Italian Society of Authors and Publishers, July 1, 2019. [Online]. Available: https://www.statista.com/statistics/551281/touring-attractions-box-office-in-italy-by-macro-region/