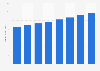
- Consumer Goods & FMCG›
- Clothing & Apparel›
Size of the U.S. athletic apparel market from 2015 to 2025
Industry-specific and extensively researched technical data (partially from exclusive partnerships).
A paid subscription is required for full access.
Size of the U.S. athletic apparel market from 2015 to 2025
Value of the sportswear market in the United States from 2015 to 2025 (in billion U.S. dollars)

Why is the sportswear market growing?
The sportswear market has benefitted from changing consumer trends over recent years. The rise of streetwear culture has led to greater demand from teenagers, while a greater interest in fitness has resulted in adults seeking comfortable yet fashionable clothing. Nike has a dominant share of the sportswear market in the United States and is regarded highly by both teenagers and adults. Around a quarter of teenagers ranked Nike as their top clothing brand, and an even greater share of adults named it their favorite sportswear brand.Sneaker market steps up
The sports footwear market in the United States was valued at around 40 billion U.S. dollars in 2019. The leading sports shoe brands amongst consumers in the country are Nike, adidas, and Skechers. Advanced technology, limited releases, and exclusive collaborations may be part of the reason why certain consumer age groups are spending around 500 U.S. dollars each year on footwear.Value of the sportswear market in the United States from 2015 to 2025 (in billion U.S. dollars)
Market value in billion U.S. dollars | |
---|---|
- | - |
- | - |
- | - |
- | - |
- | - |
- | - |
- | - |
- | - |
- | - |
- | - |
- | - |
Market value in billion U.S. dollars | |
---|---|
- | - |
- | - |
- | - |
- | - |
- | - |
- | - |
- | - |
- | - |
- | - |
- | - |
- | - |
You need a Premium Account for unlimited access.
Full access to 1m statistics
Incl. source references
Available to download in PNG, PDF, XLS format
You need a Premium Account for unlimited access.
Full access to 1m statistics
Incl. source references
Available to download in PNG, PDF, XLS format
© Statista 2019
About this statistic
Show source
Please be patient - this may take a moment
Description
Source
More information
Why is the sportswear market growing?
The sportswear market has benefitted from changing consumer trends over recent years. The rise of streetwear culture has led to greater demand from teenagers, while a greater interest in fitness has resulted in adults seeking comfortable yet fashionable clothing. Nike has a dominant share of the sportswear market in the United States and is regarded highly by both teenagers and adults. Around a quarter of teenagers ranked Nike as their top clothing brand, and an even greater share of adults named it their favorite sportswear brand.Sneaker market steps up
The sports footwear market in the United States was valued at around 40 billion U.S. dollars in 2019. The leading sports shoe brands amongst consumers in the country are Nike, adidas, and Skechers. Advanced technology, limited releases, and exclusive collaborations may be part of the reason why certain consumer age groups are spending around 500 U.S. dollars each year on footwear.- Show sources information
- Show publisher information
- Release date
- November 2019
- Region
- United States
- Survey time period
- 2019
- Supplementary notes
Source
- Show sources information
- Show publisher information
- Release date
- November 2019
More information
- Region
- United States
- Survey time period
- 2019
- Supplementary notes
Other statistics on the topic
Adidas
Clothing & Apparel
Adidas, Nike & Puma revenue comparison 2006-2018

Sports & Fitness
Footwear segment revenue of Nike, Adidas & Puma 2010-2018

Fashion & Accessories
Value of the leading global apparel brands 2019

Fashion & Accessories
Number of retail stores of the adidas Group worldwide 2008-2018, by store type
You only have access to basic statistics.
This statistic is not included in your account!
- Instant access to 1m statistics
- Download in XLS, PDF & PNG format
- Detailed references
$59 / Month *
Corporate solution including all features.
Prices do not include sales tax.


All Information
in one Presentation
- 85 page/s
- English
- pptx
- Detailed references
Everything On "Sporting goods in the United States" in One Document: Edited and Divided into Handy Chapters. Including Detailed References.
Statista is a great source of knowledge, and pretty helpful to manage the daily work.Christof Baron
CEO, MindShare Germany
- Overview
- Most reputable companies worldwide in 2018Most reputable companies worldwide 2018
- Value of the leading 10 apparel brands worldwide in 2019 (in million U.S. dollars)Value of the leading global apparel brands 2019
- Total revenue of the global sports apparel market from 2012 to 2025 (in billion U.S. dollars)*Total revenue of the global sports apparel market 2012-2025
- Projected development of the global sports footwear market from 2019 to 2025 (in billion U.S. dollars)Projected development of the global sports footwear market 2019-2025
- Sales of the leading apparel/accessories companies worldwide in 2018 (in billion U.S. dollars)Sales of the leading apparel/accessories companies worldwide 2018
- Leading athletic apparel, accessories and footwear companies worldwide in 2019, by sales (in million U.S. dollars)*Global sales of the top performance apparel, accessories and footwear companies 2019
- Sales growth forecast of the leading athletic apparel, accessories and footwear companies worldwide in 2019*Global sales growth forecast of top athletic wear companies 2019
- Value of the sportswear market in the United States from 2015 to 2025 (in billion U.S. dollars)Size of the U.S. athletic apparel market from 2015 to 2025
- Market Leaders
- Brand value of the leading 10 apparel brands worldwide in 2019 (in million U.S. dollars)Brand value of the leading 10 apparel brands worldwide 2019
- Market share of clothing and apparel brands worldwide in 2017Global market shares of the leading apparel brands in 2017
- Global revenue of Adidas, Nike and Puma from 2006 to 2018 (in billion euros)**Adidas, Nike & Puma revenue comparison 2006-2018
- Revenue from footwear segment of Nike, Adidas and Puma from 2010 to 2018 (in billion U.S. dollars)Footwear segment revenue of Nike, Adidas & Puma 2010-2018
- Brand value comparison of Nike and adidas worldwide from 2010 to 2019 (in million U.S. dollars)Global brand value comparison of Nike and adidas from 2010 to 2019
- Footwear market share of Nike and adidas as of 2017, by regionNike and adidas' share of the footwear market as of 2017, by region
- Sports footwear market share of Nike and adidas in the United States as of 2017Nike and adidas' share of the sports footwear market as of 2017
- Sales Figures
- The adidas Group's net sales worldwide from 2000 to 2018 (in million euros)The adidas Group's net sales worldwide from 2000 to 2018
- Net sales of the Reebok brand worldwide from 2006 to 2018 (in million euros)Net sales of the Reebok brand worldwide from 2006 to 2018
- Global distribution of adidas retail net sales from 2015 to 2018, by regionGlobal share of adidas retail sales from 2015 to 2018, by region
- Net sales of the adidas Group worldwide from 2002 to 2018, by product category (in million euros)Adidas Group's global net sales from 2002 to 2018, by product category
- Key Figures of adidas
- Adidas Group advertising spending in the United States from 2012 to 2018 (in million U.S. dollars)Adidas Group: ad spend in the U.S. 2012-2018
- The adidas Group's gross profit worldwide from 2000 to 2018 (in million euros)Global gross profit of the adidas Group from 2000 to 2018
- The adidas Group's income before taxes worldwide from 2000 to 2018 (in million euros)The adidas Group's income before taxes worldwide from 2000 to 2018
- Number of retail stores of the adidas Group worldwide from 2008 to 2018, by store typeNumber of retail stores of the adidas Group worldwide 2008-2018, by store type
- Number of employees of the adidas Group worldwide from 2000 to 2018Number of employees of the adidas Group worldwide from 2000 to 2018
- The adidas Group's apparel production worldwide from 2008 to 2018 (in million units)The adidas Group's global apparel production from 2008 to 2018
- The adidas Group's footwear production worldwide from 2008 to 2018 (in million pairs)The adidas Group's global footwear production from 2008-2018
- Product brands with the most Facebook fans as of September 2019 (in millions)Most popular product brands on Facebook 2019
- Consumer Behavior
- Which of these brands do you usually buy when it comes to clothing, shoes and accessories?Popular brands for clothing, shoes and accessories in the U.S. 2017
- Share of household members in the United States who owned Adidas brand apparel, accessories, and footwear in 2018, by incomeAmericans who owned Adidas brand apparel, accessories, and footwear 2018
- Which of the following brands do you know, even if just by name?*Consumer awareness of sports brands in the U.S. 2018
- Which brand would you consider your favorite for sportswear?Favorite sports apparel brands of consumers in the U.S. 2018
- From which of the following brands have you bought sportswear in the past 12 months?*Sports apparel brands U.S. consumers purchased products from in past 12 months 2018
- Which brand would you consider your favorite for sports shoes?Favorite sports shoe brands of consumers in the United States as of 2018
- Which of the following brands have you bought sports shoes in the past 12 months?*Sports shoe brands U.S. consumers bought products from in past 12 months as of 2018
- From which of the following vendors do you buy sports articles in a physical store?*Retail stores consumers purchase sports apparel/equipment from in the U.S. 2018
- Sports apparel and footwear market growth worldwide from 2008 to 2016
- Sports market value worldwide in 2018, by country
- Sports market value worldwide in 2018, by product category
- Sport and lifestyle clothing and footwear market share worldwide in 2016, by region
- Sports market share worldwide in 2018, by country
- Leading sports apparel retailers in Canada 2015, by dollar share
- Canada's number of FGL Sports stores 2016-2018
- Revenue of FGL Sports in Canada 2012-2017
- Influencing factors for U.S. consumers when purchasing denim 2012
- Locations where U.S. consumers purchase their athletic apparel 2012
- Canadian square footage revenue of FGL Sports 2016-2018
- Men's favorite brands of athletic apparel in the United States 2012
- Leading sports apparel brands in Canada 2015, by dollar share
- Average age of sports apparel purchasers at selected retailers in Canada 2015
- Market value of the global sports intimate wear industry 2009-2019
- Sales value of sports apparel of Björn Borg 2013-2018
- Athleisure trends in Mexico in 2016
- Industry revenue of »finishing of textiles« in Switzerland 2011-2023
- Industry revenue of »weaving of textiles« in Italy 2011-2023
- Most reputable companies worldwide 2018
- Value of the leading global apparel brands 2019
- Total revenue of the global sports apparel market 2012-2025
- Projected development of the global sports footwear market 2019-2025
- Sales of the leading apparel/accessories companies worldwide 2018
- Global sales of the top performance apparel, accessories and footwear companies 2019
- Global sales growth forecast of top athletic wear companies 2019
- Size of the U.S. athletic apparel market from 2015 to 2025
- Market share of the U.S. sports apparel and footwear market as of 2018, by company
- Brand value of the leading 10 apparel brands worldwide 2019
- Global market shares of the leading apparel brands in 2017
- Adidas, Nike & Puma revenue comparison 2006-2018
- Footwear segment revenue of Nike, Adidas & Puma 2010-2018
- Global brand value comparison of Nike and adidas from 2010 to 2019
- Nike and adidas' share of the footwear market as of 2017, by region
- Nike and adidas' share of the sports footwear market as of 2017
- Adidas Group: ad spend in the U.S. 2012-2018
- Global gross profit of the adidas Group from 2000 to 2018
- The adidas Group's income before taxes worldwide from 2000 to 2018
- Number of retail stores of the adidas Group worldwide 2008-2018, by store type
- Number of employees of the adidas Group worldwide from 2000 to 2018
- The adidas Group's global apparel production from 2008 to 2018
- The adidas Group's global footwear production from 2008-2018
- Most popular product brands on Facebook 2019
- Popular brands for clothing, shoes and accessories in the U.S. 2017
- Americans who owned Adidas brand apparel, accessories, and footwear 2018
- Consumer awareness of sports brands in the U.S. 2018
- Favorite sports apparel brands of consumers in the U.S. 2018
- Sports apparel brands U.S. consumers purchased products from in past 12 months 2018
- Favorite sports shoe brands of consumers in the United States as of 2018
- Sports shoe brands U.S. consumers bought products from in past 12 months as of 2018
- Retail stores consumers purchase sports apparel/equipment from in the U.S. 2018
- Online stores consumers purchase sports apparel/equipment from in the U.S. 2018
- Leading athletic apparel brands amongst average-income U.S. teens 2018
- Leading athletic apparel brands amongst upper-income U.S. teens as of 2018
- American customer satisfaction index: athletic shoe companies 1997-2019
- Sports apparel and footwear market growth worldwide from 2008 to 2016
- Sports market value worldwide in 2018, by country
- Sports market value worldwide in 2018, by product category
- Sport and lifestyle clothing and footwear market share worldwide in 2016, by region
- Sports market share worldwide in 2018, by country
- Leading sports apparel retailers in Canada 2015, by dollar share
- Canada's number of FGL Sports stores 2016-2018
- Revenue of FGL Sports in Canada 2012-2017
- Influencing factors for U.S. consumers when purchasing denim 2012
- Locations where U.S. consumers purchase their athletic apparel 2012
- Canadian square footage revenue of FGL Sports 2016-2018
- Men's favorite brands of athletic apparel in the United States 2012
- Leading sports apparel brands in Canada 2015, by dollar share
- Average age of sports apparel purchasers at selected retailers in Canada 2015
- Market value of the global sports intimate wear industry 2009-2019
- Sales value of sports apparel of Björn Borg 2013-2018
- Athleisure trends in Mexico in 2016
- Industry revenue of »finishing of textiles« in Switzerland 2011-2023
- Industry revenue of »weaving of textiles« in Italy 2011-2023
Statista offers dossiers and reports on over 170 industries. With Statista you are always able to make informed decisions and boost your work efficiency.
- Social Media
- E-Commerce
- Online Video & Entertainment
- Advertising & Marketing
- Alcoholic Beverages
- Cleaning Products
- Cosmetics & Personal Care
- Food & Nutrition
- Health & Hygiene
- International Trade
- Shopping Behavior
- Sports & Leisure
- Business Travel
- Leisure Travel
- Accomodation
- Restaurants
- Demographics
- Economy
- Education & Science
- Politics & Government
- Aviation
- Rail Transport
- Vehicles & Road Traffic
- Water Transport
You can only download this statistic as a Premium user.
As a Premium user you get access to the detailed source references and background information about this statistic.
As a Premium user you get access to background information and details about the release of this statistic.
As soon as this statistic is updated, you will immediately be notified via e-mail.
...and make my research life easier.
You need at least a Premium Account to use this feature.
This feature is limited to our corporate solutions.
Please contact us to get started with full access to dossiers, forecasts, studies and international data.
We use cookies to personalize contents and ads, offer social media features, and analyze access to our website. In your browser settings you can configure or disable this, respectively, and can delete any already placed cookies. For details, please see your browser’s Help section (by pressing F1). Please see our privacy statement for details about how we use data.