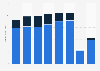
This statistic displays the year-on-year revenue change of cinema advertisements in the Netherlands from 2012 to 2018, with a forecast for 2019 to 2023. In 2018 the Dutch cinema ad revenue changed by almost 14 percent in comparison to the previous year.
Year-on-year revenue change of the cinema advertisements in the Netherlands from 2012 to 2018, with a forecast for 2019 to 2023
Basic Account
Get to know the platform
You only have access to basic statistics.
This statistic is not included in your account.
Starter Account
The ideal entry-level account for individual users
- Instant access to 1m statistics
- Download in XLS, PDF & PNG format
- Detailed references
$199 USD / Month *
Professional Account
Full access
Business Solutions including all features.
* Prices do not include sales tax.
Other statistics that may interest you Statistics on
About the industry
10
- Premium Statistic Cinema advertising spending before and after the coronavirus outbreak in Sweden 2020
- Premium Statistic Cinema advertising revenue in Denmark 2009-2020
- Premium Statistic Coronavirus impact on cinema advertising spend in the UK in 2020, by quarter
- Premium Statistic IMAX China net income 2014-2022
- Premium Statistic Box office revenue in South Korea 2004-2023
- Premium Statistic Revenue of the movie industry in the Netherlands 2010-2022
- Premium Statistic Cinema ad spend growth in Central and Eastern Europe 2000-2024
- Premium Statistic Cinema advertising spending in Norway 2009-2022
- Premium Statistic UFO Moviez India's revenue FY 2015-2023
- Premium Statistic Advertising investments in out-of-home and cinema advertising in Germany 2013-2020
About the region
9
- Premium Statistic Cinema ad revenue in the Netherlands 2021-2022
- Premium Statistic Leading film distributors in the Netherlands 2022, by revenue
- Premium Statistic Leading film distributors in the Netherlands 2022, by number of titles
- Premium Statistic Digital Market Outlook: social media advertising spending in European countries 2022
- Premium Statistic Digital Market Outlook: digital search ad spend in European countries 2022
- Premium Statistic Advertising spending growth in the Netherlands in 2022, by medium
- Premium Statistic Advertising expenditure in the Netherlands 2022, by medium
- Premium Statistic Digital ad spend growth in the Netherlands 2022, by format
- Premium Statistic Digital ad spend in the Netherlands 2012-2021, by format
Other regions
10
- Premium Statistic Ad market growth in the Nordics 2020-2022
- Premium Statistic Programmatic ad spend in Sweden 2017-2026
- Premium Statistic Programmatic ad spend in Russia 2017-2026
- Premium Statistic CAGR of the film entertainment market Australia 2019-2024 by type
- Premium Statistic Share of ad revenue in Saudi Arabia by media platform 2015
- Premium Statistic Share of ad revenue in Qatar by media platform 2015
- Premium Statistic Magazine ad expenditure in Saudi Arabia 2008-2016
- Premium Statistic Cost of primetime 30-second commercial in Asia Pacific 2016 by country
- Premium Statistic Brazil: Trivago's advertising spending 2016-2018
- Basic Statistic Ad spending distribution in Hong Kong 2012-2024, by medium
Related statistics
10
- Basic Statistic Indiana Jones franchise: domestic and global box office revenue 2023
- Premium Statistic Cinema attendance in Sweden 2009-2022
- Basic Statistic Fast & Furious movies' box office revenue in the U.S. & Canada vs. worldwide 2023
- Premium Statistic Breakdown of moviegoers in France 2019-2024, by age group
- Basic Statistic Opening weekend revenue of Marvel movies 2023
- Premium Statistic Cineplex annual revenue 2012-2023, by source
- Premium Statistic Cineplex's annual net income/loss 2011-2023
- Basic Statistic Cineplex Inc.'s quarterly revenue 2019-2022
- Basic Statistic Cineplex Inc.'s quarterly income/loss 2019-2022
- Basic Statistic Cineplex Inc.'s quarterly revenue 2019-2022, by source
Further related statistics
10
- Magazine publishing revenue in Central & Eastern Europe 2009-2016, by B2B and B2C
- John Lewis sales revenue in the United Kingdom (UK) 2009-2023
- Waitrose sales revenue in the United Kingdom (UK) 2009-2023
- Revenue of the Bank of Communications 2022
- Breakdown of U.S. online ad revenue 2023, by format
- Total revenue of Prudential Financial 2006-2022
- Net revenue from investment banking at Goldman Sachs 2009-2023
- Sales of International House of Pancakes (IHOP) restaurants in the U.S. 2009-2023
- Gross revenue of the InterContinental Hotels Group worldwide 2007-2023
- Pfizer's ad spending 2006-2023
Further Content: You might find this interesting as well
Statistics
- Magazine publishing revenue in Central & Eastern Europe 2009-2016, by B2B and B2C
- John Lewis sales revenue in the United Kingdom (UK) 2009-2023
- Waitrose sales revenue in the United Kingdom (UK) 2009-2023
- Revenue of the Bank of Communications 2022
- Breakdown of U.S. online ad revenue 2023, by format
- Total revenue of Prudential Financial 2006-2022
- Net revenue from investment banking at Goldman Sachs 2009-2023
- Sales of International House of Pancakes (IHOP) restaurants in the U.S. 2009-2023
- Gross revenue of the InterContinental Hotels Group worldwide 2007-2023
- Pfizer's ad spending 2006-2023
PwC. (October 17, 2019). Year-on-year revenue change of the cinema advertisements in the Netherlands from 2012 to 2018, with a forecast for 2019 to 2023 [Graph]. In Statista. Retrieved April 26, 2024, from https://www.statista.com/statistics/607639/cinema-advertising-revenue-change-in-the-netherlands/
PwC. "Year-on-year revenue change of the cinema advertisements in the Netherlands from 2012 to 2018, with a forecast for 2019 to 2023." Chart. October 17, 2019. Statista. Accessed April 26, 2024. https://www.statista.com/statistics/607639/cinema-advertising-revenue-change-in-the-netherlands/
PwC. (2019). Year-on-year revenue change of the cinema advertisements in the Netherlands from 2012 to 2018, with a forecast for 2019 to 2023. Statista. Statista Inc.. Accessed: April 26, 2024. https://www.statista.com/statistics/607639/cinema-advertising-revenue-change-in-the-netherlands/
PwC. "Year-on-year Revenue Change of The Cinema Advertisements in The Netherlands from 2012 to 2018, with a Forecast for 2019 to 2023." Statista, Statista Inc., 17 Oct 2019, https://www.statista.com/statistics/607639/cinema-advertising-revenue-change-in-the-netherlands/
PwC, Year-on-year revenue change of the cinema advertisements in the Netherlands from 2012 to 2018, with a forecast for 2019 to 2023 Statista, https://www.statista.com/statistics/607639/cinema-advertising-revenue-change-in-the-netherlands/ (last visited April 26, 2024)
Year-on-year revenue change of the cinema advertisements in the Netherlands from 2012 to 2018, with a forecast for 2019 to 2023 [Graph], PwC, October 17, 2019. [Online]. Available: https://www.statista.com/statistics/607639/cinema-advertising-revenue-change-in-the-netherlands/