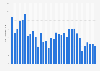
This statistic displays the average daily time spent watching television per capita in Poland from 2010 to 2014, and provides a forecast until 2017. The daily time spent per person is expected to increase from 264 minutes in 2015 to 272 minutes in 2017.
Average daily time spent watching television per capita in Poland from 2010 to 2017 (in minutes)**
Basic Account
Get to know the platform
You only have access to basic statistics.
This statistic is not included in your account.
Starter Account
The ideal entry-level account for individual users
- Instant access to 1m statistics
- Download in XLS, PDF & PNG format
- Detailed references
$199 USD / Month *
Professional Account
Full access
Business Solutions including all features.
* Prices do not include sales tax.
Other statistics that may interest you Statistics on
About the industry
9
- Premium Statistic Time spent watching TV and digital video in the U.S. 2021-2025
- Premium Statistic Daily television consumption in Russia 2017-2022
- Basic Statistic Daily time spent watching TV in Norway 2009-2019
- Basic Statistic Time spent on watching TV growth during COVID-19 Russia 2020, by age
- Premium Statistic Average time spent watching TV in Russia 2019-2020, by age
- Premium Statistic Most popular TV channels among 4-8-year-old children in Russia in 2019
- Premium Statistic Most popular TV channels among 9-13-year-old children in Russia in 2019
- Premium Statistic Most popular TV channels among 14-17-year-olds in Russia in 2019
- Premium Statistic Average time spent watching TV in large cities of Russia 2019, by age
About the region
10
- Premium Statistic Daily television consumption in Poland 2019-2021, by age
- Premium Statistic Average daily video content consumption in Poland 2020, by device
- Premium Statistic Share of devices in daily video consumption in Poland 2020
- Premium Statistic Share of platforms in digital device video streaming in Poland 2020
- Basic Statistic Most popular TV channels in Poland 2021-2022, by SHR
- Premium Statistic Average daily TV viewing time in Poland 2012-2022
- Premium Statistic Cable TV subscribers in Poland 2010-2022
- Basic Statistic Leading music TV channels in Poland 2021, by audience share
- Premium Statistic Daily time spent watching TV in Poland 2018, by age group
- Premium Statistic Average hours spent on computer, smartphone and TV in Poland 2018, by TV user type
Selected statistics
3
Other regions
9
- Premium Statistic Average daily television consumption in Greece 2010-2018
- Premium Statistic Colombia: number of SVoD subscriptions 2019-2025
- Basic Statistic Daily TV viewing time per person in the United Kingdom (UK) 2010-2025
- Premium Statistic Number of SVoD subscriptions in Australia 2013-2016
- Premium Statistic Reasons for signing up to SVoD services in Japan 2017
- Premium Statistic Distribution of households with TVs in the U.S. 2017, by category
- Basic Statistic Daily on-demand TV viewing time in selected countries worldwide 2018, by age group
- Premium Statistic Number of SVoD subscriptions in China 2013-2016
- Premium Statistic Number of SVoD subscription South Korea 2019-2025
Related statistics
10
- Premium Statistic TV and radio subscribers in Poland 2020-2021
- Premium Statistic Average daily time spent with media in Poland 2023
- Premium Statistic Most influential television stations in Poland 2022
- Premium Statistic Preferred VOD payment methods in Poland 2022
- Premium Statistic Ways of accessing long video content in Poland 2015-2022, by source type
- Premium Statistic TV programs with over 5 million viewers in Poland 2009-2021
- Premium Statistic Daily VOD consumption in Poland 2020, by age
- Premium Statistic Reasons for using paid VOD services in Poland 2020
- Premium Statistic Preferred media types in Poland 2020
- Premium Statistic Preferred websites in Poland 2020
Further related statistics
8
- Use of a smart TV to go online in the UK 2013-2020, by age
- Prepaid debit card use in U.S. households 2013-2019, by tenure
- Device usage among children to consume media in the United Kingdom (UK) 2013-2019
- Frequency of watching national news in the U.S. 2013-2016
- Consumer magazine industry revenue in North America 2008 -2016
- Magazine publishing revenue in Western Europe 2009-2016, B2B and B2C
- Magazine publishing revenue in Central & Eastern Europe 2009-2016, by B2B and B2C
- Daily time children spent with media in the U.S. in 2011 and 2013
Further Content: You might find this interesting as well
Statistics
- Use of a smart TV to go online in the UK 2013-2020, by age
- Prepaid debit card use in U.S. households 2013-2019, by tenure
- Device usage among children to consume media in the United Kingdom (UK) 2013-2019
- Frequency of watching national news in the U.S. 2013-2016
- Consumer magazine industry revenue in North America 2008 -2016
- Magazine publishing revenue in Western Europe 2009-2016, B2B and B2C
- Magazine publishing revenue in Central & Eastern Europe 2009-2016, by B2B and B2C
- Daily time children spent with media in the U.S. in 2011 and 2013
Zenith. (June 1, 2015). Average daily time spent watching television per capita in Poland from 2010 to 2017 (in minutes)** [Graph]. In Statista. Retrieved April 26, 2024, from https://www.statista.com/statistics/619971/poland-average-daily-television-consumption/
Zenith. "Average daily time spent watching television per capita in Poland from 2010 to 2017 (in minutes)**." Chart. June 1, 2015. Statista. Accessed April 26, 2024. https://www.statista.com/statistics/619971/poland-average-daily-television-consumption/
Zenith. (2015). Average daily time spent watching television per capita in Poland from 2010 to 2017 (in minutes)**. Statista. Statista Inc.. Accessed: April 26, 2024. https://www.statista.com/statistics/619971/poland-average-daily-television-consumption/
Zenith. "Average Daily Time Spent Watching Television per Capita in Poland from 2010 to 2017 (in Minutes)**." Statista, Statista Inc., 1 Jun 2015, https://www.statista.com/statistics/619971/poland-average-daily-television-consumption/
Zenith, Average daily time spent watching television per capita in Poland from 2010 to 2017 (in minutes)** Statista, https://www.statista.com/statistics/619971/poland-average-daily-television-consumption/ (last visited April 26, 2024)
Average daily time spent watching television per capita in Poland from 2010 to 2017 (in minutes)** [Graph], Zenith, June 1, 2015. [Online]. Available: https://www.statista.com/statistics/619971/poland-average-daily-television-consumption/