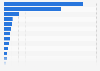
In 2021, the country across the ASEAN region which had the highest trade balance was Malaysia, with a trade balance of approximately 61 billion U.S. dollars. Contrastingly, the Philippines had the lowest trade balance, with a negative trade balance of 66 billion U.S. dollars in 2021.
Trade balance of the ASEAN region in 2021, by country (in billion U.S. dollars)
Basic Account
Get to know the platform
You only have access to basic statistics.
This statistic is not included in your account.
Starter Account
The ideal entry-level account for individual users
- Instant access to 1m statistics
- Download in XLS, PDF & PNG format
- Detailed references
$199 USD / Month *
Professional Account
Full access
Business Solutions including all features.
* Prices do not include sales tax.
Other statistics that may interest you Singapore
Population
8
- Basic Statistic Total population of Singapore 2028
- Basic Statistic Population growth in Singapore 2022
- Basic Statistic Fertility rate in Singapore
- Basic Statistic Crude birth rate in Singapore 2011-2021
- Basic Statistic Life expectancy at birth in Singapore 2021
- Basic Statistic Life expectancy at birth in Singapore 2021, by gender
- Basic Statistic Age structure in Singapore 2022
- Basic Statistic Median age of the population in Singapore 2020
Economy
8
- Basic Statistic Gross domestic product (GDP) in Singapore 2029
- Basic Statistic Gross domestic product (GDP) per capita in Singapore 2029
- Basic Statistic Gross domestic product (GDP) growth rate in Singapore 2028*
- Basic Statistic Singapore: Share in global GDP adjusted for PPP 2029
- Basic Statistic Distribution of gross domestic product (GDP) across economic sectors Singapore 2022
- Basic Statistic Employment by economic sector in Singapore 2021
- Basic Statistic Employment in Singapore 2025
- Basic Statistic Unemployment rate in Singapore 2022
National finances
5
- Premium Statistic National debt of Singapore 2029
- Basic Statistic National debt of Singapore in relation to gross domestic product (GDP) 2029
- Basic Statistic Ratio of military expenditure to gross domestic product (GDP) in Singapore 2022
- Basic Statistic Ratio of government expenditure to gross domestic product (GDP) in Singapore 2029
- Basic Statistic Singapore's budget balance in relation to GDP 2029
ASEAN country comparison
8
- Basic Statistic Total population of the ASEAN countries from 2018 to 2028
- Premium Statistic Life expectancy at birth in the ASEAN countries 2021
- Premium Statistic Death rates in the ASEAN countries 2021
- Basic Statistic Gross domestic product of the ASEAN countries from 2018 to 2028
- Premium Statistic Gross domestic product (GDP) per capita in the ASEAN countries 2028
- Premium Statistic Inflation rate in the ASEAN countries 2028
- Premium Statistic Import growth in the ASEAN region 2015 by country
- Premium Statistic Export growth in the ASEAN region 2015 by country
Digital usage
7
- Premium Statistic Internet penetration Asia 2022, by country
- Premium Statistic Internet penetration SEA 2022, by country
- Basic Statistic Number of internet users APAC 2021, by country
- Basic Statistic Countries with the fastest average internet connection speed 2017
- Premium Statistic Singapore: daily online minutes 2016
- Basic Statistic Number of social media users in Singapore 2018-2029
- Premium Statistic Social network penetration in Singapore Q3 2023
Further related statistics
18
- Trade balance of services in Zimbabwe 2022
- Trade balance of services in Tunisia 2012-2022
- Trade balance of services in Sudan 2012-2022
- Trade balance of services in Seychelles 2012-2022
- Import values of the ASEAN region by commodity 2014
- Trade balance of the ASEAN region by commodity 2014
- Import value in the ASEAN region 2021, by trading partner
- Share of the top trading partners for ASEAN exports of goods 2021
- Share of the top trading partners for ASEAN imports of goods 2021
- Annual growth rate of electronic business machines imports value Japan 2010-2018
- Export value of rice from India FY 2023, by leading destination
- Wood and wood product import value into India FY 2011-2023
- Export value of toys from Hong Kong 2014-2022, by type
- Main export partners of Sweden for poultry meat 2020
- Value of animal or vegetable fat and oil imports in Canada 2012-2020
- Nicaragua: main trade partners 2022, by trading value
- Import value of stone and glass in Ghana 1998-2019
- Share of the global packaging market 2012, by geographic region
Further Content: You might find this interesting as well
Statistics
- Trade balance of services in Zimbabwe 2022
- Trade balance of services in Tunisia 2012-2022
- Trade balance of services in Sudan 2012-2022
- Trade balance of services in Seychelles 2012-2022
- Import values of the ASEAN region by commodity 2014
- Trade balance of the ASEAN region by commodity 2014
- Import value in the ASEAN region 2021, by trading partner
- Share of the top trading partners for ASEAN exports of goods 2021
- Share of the top trading partners for ASEAN imports of goods 2021
- Annual growth rate of electronic business machines imports value Japan 2010-2018
- Export value of rice from India FY 2023, by leading destination
- Wood and wood product import value into India FY 2011-2023
- Export value of toys from Hong Kong 2014-2022, by type
- Main export partners of Sweden for poultry meat 2020
- Value of animal or vegetable fat and oil imports in Canada 2012-2020
- Nicaragua: main trade partners 2022, by trading value
- Import value of stone and glass in Ghana 1998-2019
- Share of the global packaging market 2012, by geographic region
ASEAN. (April 18, 2023). Trade balance of the ASEAN region in 2021, by country (in billion U.S. dollars) [Graph]. In Statista. Retrieved April 23, 2024, from https://www.statista.com/statistics/648203/trade-balance-asean-region-by-country/
ASEAN. "Trade balance of the ASEAN region in 2021, by country (in billion U.S. dollars)." Chart. April 18, 2023. Statista. Accessed April 23, 2024. https://www.statista.com/statistics/648203/trade-balance-asean-region-by-country/
ASEAN. (2023). Trade balance of the ASEAN region in 2021, by country (in billion U.S. dollars). Statista. Statista Inc.. Accessed: April 23, 2024. https://www.statista.com/statistics/648203/trade-balance-asean-region-by-country/
ASEAN. "Trade Balance of The Asean Region in 2021, by Country (in Billion U.S. Dollars)." Statista, Statista Inc., 18 Apr 2023, https://www.statista.com/statistics/648203/trade-balance-asean-region-by-country/
ASEAN, Trade balance of the ASEAN region in 2021, by country (in billion U.S. dollars) Statista, https://www.statista.com/statistics/648203/trade-balance-asean-region-by-country/ (last visited April 23, 2024)
Trade balance of the ASEAN region in 2021, by country (in billion U.S. dollars) [Graph], ASEAN, April 18, 2023. [Online]. Available: https://www.statista.com/statistics/648203/trade-balance-asean-region-by-country/