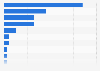
Share of spectacles exports from Hong Kong 2020, by market
This graph displays the share of spectacles exports from Hong Kong in 2020, by end market. That year, around 27.7 percent of Hong Kong's spectacles exports went to the European Union countries.