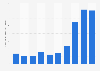
This statistic depicts the operating expenses of in food service industry in Hong Kong from 2010 to 2014. In 2013, the operating of Hong Kong's food service industry cost in total around 37.74 billion Hong Kong dollars.
Operating expenses of the food service industry in Hong Kong from 2010 to 2014 (in million Hong Kong dollars)
Basic Account
Get to know the platform
You only have access to basic statistics.
This statistic is not included in your account.
Starter Account
The ideal entry-level account for individual users
- Instant access to 1m statistics
- Download in XLS, PDF & PNG format
- Detailed references
$199 USD / Month *
Professional Account
Full access
Business Solutions including all features.
* Prices do not include sales tax.
Other statistics that may interest you Statistics on
About the industry
10
- Premium Statistic Labor force in Myanmar 2010-2019
- Premium Statistic Labor force Myanmar 2010-2019, by gender
- Premium Statistic Labor force participation rate Myanmar 2010-2019
- Premium Statistic Labor force participation rate Myanmar 2010-2019, by gender
- Premium Statistic Annual change of the unit labor costs in the Netherlands 2021-2024
- Premium Statistic Labor costs per employee in Italian foreign-/nationally controlled industries 2017
- Premium Statistic Average number of employees in the Faroe Islands 2017, by industry
- Premium Statistic Industrial gross domestic product of Hong Kong 2021, by sector
- Premium Statistic Rate of female labor force participation India 2013-2023
- Premium Statistic Gross domestic product (GDP) growth in Hong Kong 2001-2028
About the region
10
- Premium Statistic Employee number in China's Greater Bay Area cities 2020-2021
- Premium Statistic Number of internet literature writers in China 2015-2023
- Basic Statistic Number of employees in China 2013-2023
- Premium Statistic Number of newly employed people in urban China 2013-2023
- Premium Statistic Employment in urban units in China 2022, by region
- Premium Statistic Employees at state-owned, collective-owned, and private enterprises in China 2022f
- Premium Statistic Employment in urban units in China 2022, by industry
- Premium Statistic Internet literature writers' number growth in China 2016-2020
- Premium Statistic Employment in urban private units and self-employment in China 2019, by industry
- Premium Statistic Employment in urban private units and self-employment in China 2019, by region
Other regions
10
- Premium Statistic People employed in Hong Kong's accommodation & food industry 2013-2023
- Premium Statistic Total number of interim jobs in Paris 2001-2023
- Premium Statistic SBI's employment figures FY 2013-2022
- Premium Statistic Year over year change in employee costs for companies India FY 2012 - FY 2016
- Premium Statistic Transport and logistics workforce in Australia 2017
- Premium Statistic Economically inactive people in London (UK) in 2017/18, by gender and age
- Premium Statistic People working in the construction sector in Italy 2000-2022
- Premium Statistic Employee number in the food and beverage serving industry in Norway 2011-2018
- Premium Statistic Argentina: workforce in the automotive sector 2009-2021
- Premium Statistic Mexico: food industry employees 2020, by state
Related statistics
10
- Premium Statistic Number of employees in Hong Kong's cultural and creative industries 2011-2021
- Premium Statistic Number of people employed in Hong Kong's import/export trade 2013-2023
- Premium Statistic Number of people employed in Hong Kong's transportation industry 2013-2023
- Premium Statistic People employed in Hong Kong's finance, insurance & real estate industry 2013-2023
- Premium Statistic Number of people employed in Hong Kong's social services industry 2013-2023
- Premium Statistic Number of people employed in Hong Kong's construction industry 2013-2022
- Premium Statistic Number of employees in Hong Kong's entertainment services 2011-2021
- Premium Statistic Number of employees in Hong Kong's design industry 2011-2021
- Premium Statistic Number of employees in Hong Kong's software industry 2011-2021
- Premium Statistic Number of employees in Hong Kong's television and radio industry 2011-2021
Further related statistics
10
- Main employment centers of HSBC in 2023, by number of employees
- Number of food-preparation workers in the restaurant industry in the U.S. 2010-2026
- Number of bartenders employed in the restaurant industry in the U.S. 2010-2026
- Number of waiters and waitresses in the restaurant industry in the U.S. 2010-2026
- Number of Rio Tinto's employees 2010-2023
- Number of CBRE Group employees 2009-2022
- Number of employees at HSBC 2010-2023
- Biofuels related jobs worldwide by region 2019
- Reasons restaurant employees took a break from the industry in the U.S. as of 2013
- Trend in buying prepared sandwiches in Great Britain 2005-2013
Further Content: You might find this interesting as well
Statistics
- Main employment centers of HSBC in 2023, by number of employees
- Number of food-preparation workers in the restaurant industry in the U.S. 2010-2026
- Number of bartenders employed in the restaurant industry in the U.S. 2010-2026
- Number of waiters and waitresses in the restaurant industry in the U.S. 2010-2026
- Number of Rio Tinto's employees 2010-2023
- Number of CBRE Group employees 2009-2022
- Number of employees at HSBC 2010-2023
- Biofuels related jobs worldwide by region 2019
- Reasons restaurant employees took a break from the industry in the U.S. as of 2013
- Trend in buying prepared sandwiches in Great Britain 2005-2013
HKExnews. (November 17, 2016). Operating expenses of the food service industry in Hong Kong from 2010 to 2014 (in million Hong Kong dollars) [Graph]. In Statista. Retrieved April 23, 2024, from https://www.statista.com/statistics/680989/hong-kong-food-service-industry-operating-expenses/
HKExnews. "Operating expenses of the food service industry in Hong Kong from 2010 to 2014 (in million Hong Kong dollars)." Chart. November 17, 2016. Statista. Accessed April 23, 2024. https://www.statista.com/statistics/680989/hong-kong-food-service-industry-operating-expenses/
HKExnews. (2016). Operating expenses of the food service industry in Hong Kong from 2010 to 2014 (in million Hong Kong dollars). Statista. Statista Inc.. Accessed: April 23, 2024. https://www.statista.com/statistics/680989/hong-kong-food-service-industry-operating-expenses/
HKExnews. "Operating Expenses of The Food Service Industry in Hong Kong from 2010 to 2014 (in Million Hong Kong Dollars)." Statista, Statista Inc., 17 Nov 2016, https://www.statista.com/statistics/680989/hong-kong-food-service-industry-operating-expenses/
HKExnews, Operating expenses of the food service industry in Hong Kong from 2010 to 2014 (in million Hong Kong dollars) Statista, https://www.statista.com/statistics/680989/hong-kong-food-service-industry-operating-expenses/ (last visited April 23, 2024)
Operating expenses of the food service industry in Hong Kong from 2010 to 2014 (in million Hong Kong dollars) [Graph], HKExnews, November 17, 2016. [Online]. Available: https://www.statista.com/statistics/680989/hong-kong-food-service-industry-operating-expenses/