


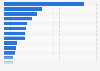

Tribune Media earnings per share 2013-2018
This statistic contains data on the earnings per share ratio of the Tribune Media Company in the fiscal years 2013 to 2018. In the last measured period, the American conglomerate, which has its headquarters in Chicago, earned 4.71 U.S. dollars per share of common stock.


