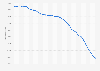
The statistic depicts the consumer expenditure on still image and text online content distribution in Japan from 2009 to 2014. In 2009, consumers spent approximately 243 billion Japanese Yen on paid online text and non-moving images content. This number decreased to around 193 billion yen in 2014.
Consumer expenditure on still image and text online content distribution in Japan from 2009 to 2014 (in billion Japanese Yen)
Basic Account
Get to know the platform
You only have access to basic statistics.
This statistic is not included in your account.
Starter Account
The ideal entry-level account for individual users
- Instant access to 1m statistics
- Download in XLS, PDF & PNG format
- Detailed references
$199 USD / Month *
Professional Account
Full access
Business Solutions including all features.
* Prices do not include sales tax.
Other statistics that may interest you Statistics on
About the industry
10
- Premium Statistic Consumer spending on online games in Japan 2009-2017
- Basic Statistic Video game retail: access and ownership revenues in the United Kingdom (UK) 2012-2022
- Premium Statistic Music downloads: free and paid downloads in Spain 2007-2022
- Premium Statistic Entertainment retail: access and ownership revenues in the United Kingdom 2012-2020
- Premium Statistic Average gaming-related expenditures per gamer worldwide 2018, by type
- Premium Statistic Average gaming-related expenditures per gamer in Canada 2018, by type
- Premium Statistic Reasons for in-game purchasing in the U.S. 2018
- Premium Statistic In-game spending distribution in the U.S. 2018, by gender
- Premium Statistic Digital newspaper subscription price in the U.S. 2016, by subscription model
- Premium Statistic U.S. mobile download and in-app revenues 2013-2016
About the region
10
- Premium Statistic Sales share of digital game among online content Japan 2010-2017
- Premium Statistic Mobile phone games consumer spending in Japan 2013-2017
- Premium Statistic Consumer spending on smartphone games in Japan 2011-2017
- Premium Statistic Leading types of mobile game acquisition in Japan in 2017
- Premium Statistic E-commerce consumer spending in Japan 2023, by category
- Premium Statistic Midsummer gifts retail market size in Japan 2014-2023
- Premium Statistic Year-end gifts retail market size in Japan 2014-2023
- Premium Statistic Bags and purses retail market share in Japan in FY 2017, by category
- Premium Statistic Animation consumer spending in Japan 1980-2017
- Premium Statistic Otaku expenditure on hobbies in Japan 2023, by category
Other regions
10
- Premium Statistic U.S. consumer spending on digital home entertainment 2012-2022, by type
- Basic Statistic Online activities ranked by usage penetration in Great Britain (GB) 2019
- Premium Statistic Most used content types South Korea 2021
- Premium Statistic Digital video games revenue in the UK 2017-2027, by category
- Premium Statistic Brazil: share of internet users downloading games 2017-2022, by age
- Premium Statistic Frequency of online video game consumption in France 2018
- Premium Statistic Breakdown of mobile gamers in China as of 2013, by age group
- Premium Statistic Kenya computer games market value 2014-2023
- Premium Statistic Colombia: number of players in VOLK Games eSports tournaments 2021
- Premium Statistic Growth of digital ad spend Thailand 2013-2021
Related statistics
10
- Premium Statistic Functional foods market share in Japan 2021, by type
- Premium Statistic Main reasons for buying online in Japan 2023
- Premium Statistic Bags and purses retail market size in Japan FY 2014-2024
- Premium Statistic Export value share from Japan 2022, by commodity
- Premium Statistic Infant goods and services market size in Japan 2014-2024
- Premium Statistic E-commerce consumer spending annual growth in Japan 2023, by category
- Premium Statistic Average monthly single household online spending in Japan 2023, by product
- Premium Statistic Average monthly two-person household online spending in Japan 2023, by product
- Premium Statistic Average monthly major city household online spending in Japan 2023, by product
- Premium Statistic Average small-city household monthly online expenditure in Japan 2023, by product
Further related statistics
10
- Revenue of Sohu in China 2022, by segment
- Netflix's streaming content obligations 2010-2023, by type
- Primary energy consumption in China 2012-2022
- EBIT of Nestlé Waters worldwide 2007-2019
- Nestlé Waters' sales distribution share worldwide 2010-2019
- Average time spent with magazines in North America in 2018, by format
- Consumer expenditure on live entertainment in the U.S. 1999-2013
- Consumer expenditure on photo studios in the U.S. 1999-2013
- Most searched hair care brands on Baidu in China Q3 2013
- China: 3G/4G share of total mobile connections
Further Content: You might find this interesting as well
Statistics
- Revenue of Sohu in China 2022, by segment
- Netflix's streaming content obligations 2010-2023, by type
- Primary energy consumption in China 2012-2022
- EBIT of Nestlé Waters worldwide 2007-2019
- Nestlé Waters' sales distribution share worldwide 2010-2019
- Average time spent with magazines in North America in 2018, by format
- Consumer expenditure on live entertainment in the U.S. 1999-2013
- Consumer expenditure on photo studios in the U.S. 1999-2013
- Most searched hair care brands on Baidu in China Q3 2013
- China: 3G/4G share of total mobile connections
Dentsu. (February 28, 2016). Consumer expenditure on still image and text online content distribution in Japan from 2009 to 2014 (in billion Japanese Yen) [Graph]. In Statista. Retrieved April 27, 2024, from https://www.statista.com/statistics/690392/japan-consumer-spending-on-image-and-text-digital-content/
Dentsu. "Consumer expenditure on still image and text online content distribution in Japan from 2009 to 2014 (in billion Japanese Yen)." Chart. February 28, 2016. Statista. Accessed April 27, 2024. https://www.statista.com/statistics/690392/japan-consumer-spending-on-image-and-text-digital-content/
Dentsu. (2016). Consumer expenditure on still image and text online content distribution in Japan from 2009 to 2014 (in billion Japanese Yen). Statista. Statista Inc.. Accessed: April 27, 2024. https://www.statista.com/statistics/690392/japan-consumer-spending-on-image-and-text-digital-content/
Dentsu. "Consumer Expenditure on Still Image and Text Online Content Distribution in Japan from 2009 to 2014 (in Billion Japanese Yen)." Statista, Statista Inc., 28 Feb 2016, https://www.statista.com/statistics/690392/japan-consumer-spending-on-image-and-text-digital-content/
Dentsu, Consumer expenditure on still image and text online content distribution in Japan from 2009 to 2014 (in billion Japanese Yen) Statista, https://www.statista.com/statistics/690392/japan-consumer-spending-on-image-and-text-digital-content/ (last visited April 27, 2024)
Consumer expenditure on still image and text online content distribution in Japan from 2009 to 2014 (in billion Japanese Yen) [Graph], Dentsu, February 28, 2016. [Online]. Available: https://www.statista.com/statistics/690392/japan-consumer-spending-on-image-and-text-digital-content/