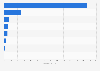
This statistic shows the summer holiday budgets of Italians aged between 18 and 65 in 2017. According to this survey, more than 60 percent of holiday-makers are going on a high value holiday in 2017. In contrast, around one in five will be camping or renting a room or a house, while 15 percent of holiday-makers are planning on staying either with a friend or relative or at their own holiday house.
Summer holiday budget among the Italian population in 2017
Basic Account
Get to know the platform
You only have access to basic statistics.
This statistic is not included in your account.
Starter Account
The ideal entry-level account for individual users
- Instant access to 1m statistics
- Download in XLS, PDF & PNG format
- Detailed references
$199 USD / Month *
Professional Account
Full access
Business Solutions including all features.
* Prices do not include sales tax.
Other statistics that may interest you Statistics on
About the industry
10
- Premium Statistic Italy: willingness to spend a lottery win on a holiday by amount 2018
- Premium Statistic Italy: holiday booking behavior 2017, by age
- Premium Statistic Main reasons for booking summer holidays via travel agencies in Italy 2020
- Premium Statistic Summer holiday booking behavior in Italy 2020
- Premium Statistic Italy: digital tourists' reasons for booking holidays through a travel agent 2018
- Premium Statistic Summer holidays booking time in Italy 2020
- Premium Statistic Share of foreign overnights stays in holiday rentals in France Q4 2019, by area
- Premium Statistic Number guest nights in Japan 2022, by region
- Premium Statistic Tourism expenditure share for accommodation by foreign visitors in Japan 2014-2022
- Premium Statistic International visitors' per capita accommodation expenditure in Japan 2023, by region
About the region
9
- Premium Statistic Italy: sources of inspiration for holiday planning 2017
- Premium Statistic Share of Italians going on summer holidays 2016-2021
- Premium Statistic Italy: holiday scam experiences 2017
- Premium Statistic Italy: top ten holiday destinations 2017
- Premium Statistic Average length of trips by Italian domestic and outbound tourists 2019 by type
- Premium Statistic Italy: what holiday-makers would like to bring back from their next holiday 2018
- Premium Statistic Holiday expenditure of inbound tourists in Italy 2018-2020, by country of residence
- Premium Statistic Outbound holiday trips from Italy 2019, by macro-region of origin
- Premium Statistic Inbound tourists' average length of trips in Italy 2015-2019, by continent
Selected statistics
3
Other regions
10
- Premium Statistic Number of international visitors to Australia FY 2023, by purpose of visit
- Basic Statistic Most expensive passports worldwide 2023
- Premium Statistic Most expensive countries for U.S. travelers concerning hotel daily rates in 2013
- Premium Statistic Willingness to spend on travel in Germany 2019-2023
- Premium Statistic Revenue of CYTS Tours 2019-2023, by product segment
- Premium Statistic Available capacity of hotels in Saudi Arabia 2008-2020
- Basic Statistic European cities ranked as the most welcoming for tourists 2017
- Basic Statistic Forecasted tourism expenditure UK 2014-2025
- Premium Statistic Number of cruise visitors to Aruba 2008-2022
- Basic Statistic Economic contribution of tourism in England (UK) 2013
Related statistics
9
- Premium Statistic Number of overnight stays for trips of Italian travelers 2007-2019
- Premium Statistic Italy: per capita expenditure of foreign tourists by continent 2017
- Premium Statistic Italy: tourist arrivals in Emilia-Romagna by municipality 2016
- Basic Statistic Most visited tourist attractions worldwide as of April 2014
- Premium Statistic Expenditure of Italian outbound tourists 2007-2022
- Premium Statistic Share of trips by Italians 2022, by age and gender of tourist
- Premium Statistic Density of the regional hotel offer in Italy 2020
- Premium Statistic Expenditure of Italian tourists abroad as a share of GDP 2010-2020
- Premium Statistic Expenditure of inbound tourists in Italy 2014-2020, by travel reason
Further related statistics
10
- Annual revenue of China Tourism Group Duty Free 2013-2023
- Number of Royal Caribbean Cruises passenger cruise days worldwide 2007-2023
- Number of cruises and voyages in Asia 2013-2019
- Change in number of visitors from Mexico to the U.S. 2018-2024
- Number of Royal Caribbean Cruises available passenger cruise days worldwide 2007-2023
- Number of cruise ships active in Asia 2013-2019, by size category
- Cruise sector: direct expenditures in Europe 2017, by country
- International tourist arrivals in Europe 2006-2023
- Number of Marriott International hotel rooms worldwide 2009-2023
- Countries with the highest number of inbound tourist arrivals worldwide 2019-2022
Further Content: You might find this interesting as well
Statistics
- Annual revenue of China Tourism Group Duty Free 2013-2023
- Number of Royal Caribbean Cruises passenger cruise days worldwide 2007-2023
- Number of cruises and voyages in Asia 2013-2019
- Change in number of visitors from Mexico to the U.S. 2018-2024
- Number of Royal Caribbean Cruises available passenger cruise days worldwide 2007-2023
- Number of cruise ships active in Asia 2013-2019, by size category
- Cruise sector: direct expenditures in Europe 2017, by country
- International tourist arrivals in Europe 2006-2023
- Number of Marriott International hotel rooms worldwide 2009-2023
- Countries with the highest number of inbound tourist arrivals worldwide 2019-2022
Coop Italia. (April 12, 2017). Summer holiday budget among the Italian population in 2017 [Graph]. In Statista. Retrieved April 25, 2024, from https://www.statista.com/statistics/717567/summer-holiday-budget-italy/
Coop Italia. "Summer holiday budget among the Italian population in 2017." Chart. April 12, 2017. Statista. Accessed April 25, 2024. https://www.statista.com/statistics/717567/summer-holiday-budget-italy/
Coop Italia. (2017). Summer holiday budget among the Italian population in 2017. Statista. Statista Inc.. Accessed: April 25, 2024. https://www.statista.com/statistics/717567/summer-holiday-budget-italy/
Coop Italia. "Summer Holiday Budget among The Italian Population in 2017." Statista, Statista Inc., 12 Apr 2017, https://www.statista.com/statistics/717567/summer-holiday-budget-italy/
Coop Italia, Summer holiday budget among the Italian population in 2017 Statista, https://www.statista.com/statistics/717567/summer-holiday-budget-italy/ (last visited April 25, 2024)
Summer holiday budget among the Italian population in 2017 [Graph], Coop Italia, April 12, 2017. [Online]. Available: https://www.statista.com/statistics/717567/summer-holiday-budget-italy/