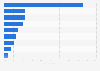
This statistic shows in which retail channels consumers most often shopped for portable lighting products in the United States as of 2018. The survey revealed that 47.1 percent of U.S. consumers would shop for portable lighting products most often in discount stores.
In which retail channels would you most often shop for portable lighting products?*
Basic Account
Get to know the platform
You only have access to basic statistics.
This statistic is not included in your account.
Starter Account
The ideal entry-level account for individual users
- Instant access to 1m statistics
- Download in XLS, PDF & PNG format
- Detailed references
$199 USD / Month *
Professional Account
Full access
Business Solutions including all features.
* Prices do not include sales tax.
Other statistics that may interest you Statistics on
About the industry
10
- Premium Statistic Price expectations for portable lighting among U.S. consumers 2018, by product
- Premium Statistic Home specialty stores shopped at for lighting products among U.S. consumers 2018
- Premium Statistic Portable lighting products most likely to be purchased among U.S. consumer 2018
- Premium Statistic Portable lighting technology most likely to be purchased among U.S. consumer 2018
- Premium Statistic Retail channels U.S. consumer would most often shop for dinnerware products 2020
- Premium Statistic U.S.: discount stores consumers are most likely to shop at for dinnerware 2020
- Premium Statistic Home specialty stores most likely to shop in for dinnerware among U.S. consumers 2020
- Premium Statistic Retail channels most often shopped in for kitchen tools among U.S. consumers 2020
- Premium Statistic Discount stores most likely shopped at for flatware among U.S. consumer 2019
- Premium Statistic Flatware set most likely purchased by U.S. consumers 2019, by size
About the region
10
- Premium Statistic Lighting purchase plans of U.S. consumers 2020
- Premium Statistic Lighting change plans of U.S. consumers 2020, by area of home
- Premium Statistic Home lighting change plans of U.S. consumers 2020
- Premium Statistic Important factors when selecting home lighting among U.S. consumers 2020
- Premium Statistic Price expectations for stick goods among U.S. consumers 2020, by product
- Premium Statistic Retail channels shopped at for cleaning goods among U.S. consumers 2020
- Premium Statistic Discount stores most likely to shop at for stick goods among U.S. consumers 2020
- Premium Statistic Frequency of mop replacement among U.S. consumers 2018
- Premium Statistic Frequency of broom replacement among U.S. consumers 2018
- Premium Statistic Retail channels for frequently wall décor shopping among U.S. consumer 2018
Selected statistics
1
Other regions
10
- Premium Statistic Tungsten halogen filament lamps for a voltage <100V: sales value in the UK 2009-2020
- Premium Statistic Malaysia: methods of receiving purchased products 2015
- Premium Statistic Ukraine: methods of receiving purchased products 2015
- Premium Statistic Argentina: methods of receiving purchased products 2015
- Premium Statistic Australia: methods of receiving purchased products 2015
- Premium Statistic Mexico: methods of receiving purchased products 2015
- Premium Statistic Romania: methods of receiving purchased products 2015
- Premium Statistic Brazil: methods of receiving purchased products 2015
- Premium Statistic Slovenia: methods of receiving purchased products 2015
- Premium Statistic Belgium: methods of receiving purchased products 2015
Related statistics
9
- Premium Statistic Home specialty stores most likely to shop at for wall décor among U.S. consumers 2018
- Premium Statistic Important factors for purchasing wall décor among U.S. consumers 2018
- Premium Statistic Retail channels shopped at for flatware products among U.S. consumer 2019
- Premium Statistic Home specialty stores most likely to shop in for flatware among U.S. consumers 2019
- Premium Statistic Price expectations for a picture frame among U.S. consumers 2018
- Premium Statistic Price expectations for wall décor among U.S. consumers 2018, by product
- Premium Statistic Influential factors for purchasing wall décor among U.S. consumers 2018
- Premium Statistic Leading light bulb brands in the U.S. 2016, based on sales
- Premium Statistic Small electric household appliance consumption in the UK Q1 2014 - Q1 2023
Further related statistics
9
- Global net sales of Monster Beverage 2008-2022
- Global Lindt & Sprüngli sales 2010-2022
- LG Electronics revenue by segment 2016-2023, by quarter
- Per capita consumer spending in India 1974-2012
- Barnes & Noble sales 2012-2019, by commerce segment
- Leading moist towelette brands in the U.S. 2018, based on sales
- Most used HVAC brands in the U.S. 2018
- Most used lighting brands in the U.S. 2018
- Most used refrigerators brands in the U.S. 2015
Further Content: You might find this interesting as well
Statistics
- Global net sales of Monster Beverage 2008-2022
- Global Lindt & Sprüngli sales 2010-2022
- LG Electronics revenue by segment 2016-2023, by quarter
- Per capita consumer spending in India 1974-2012
- Barnes & Noble sales 2012-2019, by commerce segment
- Leading moist towelette brands in the U.S. 2018, based on sales
- Most used HVAC brands in the U.S. 2018
- Most used lighting brands in the U.S. 2018
- Most used refrigerators brands in the U.S. 2015
HomeWorld Business. (October 26, 2018). In which retail channels would you most often shop for portable lighting products?* [Graph]. In Statista. Retrieved April 23, 2024, from https://www.statista.com/statistics/733972/retail-channels-most-often-shopped-in-for-portable-lighting-products-us/
HomeWorld Business. "In which retail channels would you most often shop for portable lighting products?*." Chart. October 26, 2018. Statista. Accessed April 23, 2024. https://www.statista.com/statistics/733972/retail-channels-most-often-shopped-in-for-portable-lighting-products-us/
HomeWorld Business. (2018). In which retail channels would you most often shop for portable lighting products?*. Statista. Statista Inc.. Accessed: April 23, 2024. https://www.statista.com/statistics/733972/retail-channels-most-often-shopped-in-for-portable-lighting-products-us/
HomeWorld Business. "In Which Retail Channels Would You Most Often Shop for Portable Lighting Products?*." Statista, Statista Inc., 26 Oct 2018, https://www.statista.com/statistics/733972/retail-channels-most-often-shopped-in-for-portable-lighting-products-us/
HomeWorld Business, In which retail channels would you most often shop for portable lighting products?* Statista, https://www.statista.com/statistics/733972/retail-channels-most-often-shopped-in-for-portable-lighting-products-us/ (last visited April 23, 2024)
In which retail channels would you most often shop for portable lighting products?* [Graph], HomeWorld Business, October 26, 2018. [Online]. Available: https://www.statista.com/statistics/733972/retail-channels-most-often-shopped-in-for-portable-lighting-products-us/