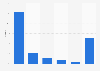
Market share of leading smartphone brands in the Netherlands 2017-2018

Market share of leading smartphone brands in the Netherlands in 2017 and 2018*

Loading statistic...
Download
Show detailed source information?
Register for free
Already a member?
Log in
Source

Use Ask Statista Research Service

Release date

March 2018

Region

Netherlands

Survey time period

2017 and 2018

Number of respondents

n 2017 = 8,500; n 2018 = "over" 1,000

Special properties

consumers

Supplementary notes

* For 2018, the source only provided a top three. Numbers on brands like Acer, HTC, Asus or OnePlus were not mentioned at all.

Citation formats
Statista Accounts: Access All Statistics. Starting from $2,388 USD / Year
Basic Account
Get to know the platform

You only have access to basic statistics.

Starter Account
The ideal entry-level account for individual users
  • Instant access to 1m statistics
  • Download in XLS, PDF & PNG format
  • Detailed references
$199 USD / Month *
Professional Account
Full access

Business Solutions including all features.

* Prices do not include sales tax.

Statistics on " Consumer electronics in the Netherlands "

Other statistics that may interest you Consumer electronics in the Netherlands

Overview

7

TV and video

8

Computer/laptop

5

Gaming

7

Mobile devices

8

Other consumer electronics

5

Media brand perception

8

Further related statistics

17
Statista Accounts: Access All Statistics. Starting from $2,388 USD / Year
Learn more about how Statista can support your business.