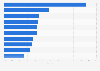
This graph shows the distribution of the liabilities of the French group PSA Peugeot Citroën worldwide in 2019, by type, in million euros. The group's non-current liabilities represented almost 22 billion euros for a total of liabilities of almost 70 billion euros.
Distribution of the liabilities of the French group PSA Peugeot Citroën abroad in 2019, by type (in million euros)
Basic Account
Get to know the platform
You only have access to basic statistics.
This statistic is not included in your account.
Starter Account
The ideal entry-level account for individual users
- Instant access to 1m statistics
- Download in XLS, PDF & PNG format
- Detailed references
$199 USD / Month *
Professional Account
Full access
Business Solutions including all features.
* Prices do not include sales tax.
Other statistics that may interest you Statistics on
About the industry
10
- Premium Statistic Total sales volume of the PSA Peugeot Citroën group by brand 2016
- Premium Statistic PSA Peugeot Citroën global sales volume by Peugeot model 2018-2019
- Premium Statistic PSA Peugeot Citroën global sales volume 2018-2019, by Citroën model
- Premium Statistic Assets of the PSA Peugeot Citroën group 2019, by type
- Premium Statistic Sales volume of the PSA Peugeot Citroën group by brand in Europe 2018-2019
- Basic Statistic Total number of PSA Peugeot Citroën employees 2013-2019
- Basic Statistic Number of short-term vehicle rental companies in France 2011-2016
- Premium Statistic PSA Peugeot Citroën Group's global sales volume 2015-2019, by DS model
- Premium Statistic Total workforce of the PSA Peugeot Citroën Group in France 2013-2017
- Premium Statistic Total equity of the Ford Motor Company 2007-2023
About the region
10
- Basic Statistic Proven reserves of the TotalEnergies 2010-2022
- Premium Statistic Global chemical companies based on number of employees 2023
- Premium Statistic Global chemical companies based on enterprise value 2023
- Premium Statistic Key global offshore drilling companies' revenue 2022-2023
- Basic Statistic Key global land drilling energy services and equipment companies' revenue 2022-2023
- Premium Statistic Largest Indiegogo campaigns worldwide 2023
- Basic Statistic Most affluent women worldwide 2023, by net worth
- Basic Statistic Highest run partnerships in test cricket 2023
- Premium Statistic Leading global oil and gas producers based on revenue 2023
- Premium Statistic World's largest construction machinery manufacturers by sales 2022
Other regions
10
- Basic Statistic Pleasure boats: number of manufacturers in France 2012-2021
- Basic Statistic Chile: company problems due to COVID-19
- Premium Statistic Ranking of venture capital availability in the Benelux region 2019, by country
- Premium Statistic Ranking of the highest-earning CEOs in the world 2015
- Premium Statistic Start-up acquisition deals in India H1 2022
- Premium Statistic Most valuable South African brands 2023
- Premium Statistic General government expenditure in Tunisia 2010-2027
- Premium Statistic Leading banks in Kenya 2022, by tier 1 capital
- Premium Statistic Colombia: Google operating revenue in 2020-2021
- Premium Statistic Foreign exchange reserves in Taiwan 2012-2022
Related statistics
10
- Premium Statistic Revenue of Hebei Iron and Steel (HBIS) China 2010-2021
- Premium Statistic Total assets of Hebei Iron and Steel (HBIS) China 2010-2021
- Premium Statistic Number of employees at Hebei Iron and Steel (HBIS) China 2010-2021
- Premium Statistic Baowu: crude steel production 2012-2022
- Premium Statistic China Railway Construction Corporation (CRCC): gross profit 2010-2021
- Premium Statistic Production volume of Ansteel 2010-2021, by product
- Premium Statistic China's imports of semi-finished and finished steel products 2008-2020
- Premium Statistic Number of flight hours of general aviation in China 2010-2021
- Premium Statistic North American equipment rental market size 2000-2024
- Premium Statistic Leading aerospace and defense manufacturers in the U.S. 2021
Further related statistics
10
- Syngenta's sales in the crop protection segment worldwide 2013-2022
- Employee count of Fluor Corporation 2008-2022
- Hugo Boss - EBITDA 2005-2023
- Number of Hugo Boss stores worldwide in 2023, by region
- MorphoSys' revenue 2006-2023
- MorphoSys' research & development expenditure 2006-2023
- Shareholders equity at Allianz Group 2008-2022
- Revenue per available room of Las Vegas Sand hotels 2009-2023, by property
- Total assets of MGM Resorts International worldwide 2008-2022
- Global advertising expenditure of Colgate-Palmolive 2009-2023
Further Content: You might find this interesting as well
Statistics
- Syngenta's sales in the crop protection segment worldwide 2013-2022
- Employee count of Fluor Corporation 2008-2022
- Hugo Boss - EBITDA 2005-2023
- Number of Hugo Boss stores worldwide in 2023, by region
- MorphoSys' revenue 2006-2023
- MorphoSys' research & development expenditure 2006-2023
- Shareholders equity at Allianz Group 2008-2022
- Revenue per available room of Las Vegas Sand hotels 2009-2023, by property
- Total assets of MGM Resorts International worldwide 2008-2022
- Global advertising expenditure of Colgate-Palmolive 2009-2023
PSA Peugeot Citroën. (April 3, 2017). Distribution of the liabilities of the French group PSA Peugeot Citroën abroad in 2019, by type (in million euros) [Graph]. In Statista. Retrieved April 24, 2024, from https://www.statista.com/statistics/790100/passive-psa-peugeot-citroen-world-by-type/
PSA Peugeot Citroën. "Distribution of the liabilities of the French group PSA Peugeot Citroën abroad in 2019, by type (in million euros)." Chart. April 3, 2017. Statista. Accessed April 24, 2024. https://www.statista.com/statistics/790100/passive-psa-peugeot-citroen-world-by-type/
PSA Peugeot Citroën. (2017). Distribution of the liabilities of the French group PSA Peugeot Citroën abroad in 2019, by type (in million euros). Statista. Statista Inc.. Accessed: April 24, 2024. https://www.statista.com/statistics/790100/passive-psa-peugeot-citroen-world-by-type/
PSA Peugeot Citroën. "Distribution of The Liabilities of The French Group Psa Peugeot Citroën Abroad in 2019, by Type (in Million Euros)." Statista, Statista Inc., 3 Apr 2017, https://www.statista.com/statistics/790100/passive-psa-peugeot-citroen-world-by-type/
PSA Peugeot Citroën, Distribution of the liabilities of the French group PSA Peugeot Citroën abroad in 2019, by type (in million euros) Statista, https://www.statista.com/statistics/790100/passive-psa-peugeot-citroen-world-by-type/ (last visited April 24, 2024)
Distribution of the liabilities of the French group PSA Peugeot Citroën abroad in 2019, by type (in million euros) [Graph], PSA Peugeot Citroën, April 3, 2017. [Online]. Available: https://www.statista.com/statistics/790100/passive-psa-peugeot-citroen-world-by-type/