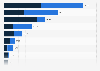
This statistic displays the distribution of hotel facilities in Italy in 2015, broken down by macro-region. According to data, 41.3 percent of all the hotels in Italy were located in the northeastern part of the country, whereas roughly 21 percent of hotel accommodations available in Italy could be found in the south of the country and on the islands.
Distribution of hotel facilities in Italy in 2015, by macro-region
Basic Account
Get to know the platform
You only have access to basic statistics.
This statistic is not included in your account.
Starter Account
The ideal entry-level account for individual users
- Instant access to 1m statistics
- Download in XLS, PDF & PNG format
- Detailed references
$199 USD / Month *
Professional Account
Full access
Business Solutions including all features.
* Prices do not include sales tax.
Other statistics that may interest you Statistics on
About the industry
10
- Premium Statistic Number of beds in five-star hotels in Italy 2020, by region
- Premium Statistic Italy: average size of hotel rooms in 2010-2016
- Premium Statistic Number of rooms in four-star hotels in Italy 2022, by region
- Premium Statistic Distribution of hotel beds in Italy 2020, by region
- Premium Statistic Number of three-star hotels in Italy 2020, by region
- Premium Statistic Number of rooms in three-star hotels in Italy 2020, by region
- Premium Statistic Italy: number of Italian hotels registered on bed banks in 2017, by region
- Premium Statistic Number of hotel beds in Italy 2019-2021, by macro-region
- Premium Statistic Number of hotel rooms in Italy 2022, by region
- Premium Statistic Number of four-star hotels in Italy 2022, by region
About the region
9
- Premium Statistic Number of rooms in five-star hotels in Italy 2022, by region
- Premium Statistic Number of five-star hotels in Italy 2022, by region
- Premium Statistic Share of inbound tourists' overnight stays in hotel facilities in Italy 2019-2020
- Premium Statistic Number of beds in three-star hotels in Italy 2019, by region
- Basic Statistic Italy: share of holiday accommodations with internet connection 2018, by region
- Premium Statistic Italy: distribution of tourist accommodation facilities in 2015, by type
- Premium Statistic Number of hotel rooms in Italy 2010-2022
- Premium Statistic Number of beds in non-hotel facilities in Italy 2019-2020, by type of facility
- Premium Statistic Overnight stays in hotels in Italy 2019, by hotel rating
Selected statistics
10
- Basic Statistic Quarterly average daily rate of hotels in Houston 2016-2017
- Basic Statistic Quarterly average daily rate of hotels in Indianapolis 2016-2017
- Basic Statistic Quarterly average daily rate of hotels in New York 2016-2017
- Basic Statistic Quarterly average daily rate of hotels in Philadelphia 2016-2017
- Basic Statistic Quarterly average daily rate of hotels in Portland 2016-2017
- Basic Statistic Quarterly average daily rate of hotels in Brussels 2010-2017
- Basic Statistic Quarterly average daily rate of hotels in Seattle 2016-2017
- Basic Statistic Quarterly average daily rate of hotels in San Diego 2016-2017
- Basic Statistic Quarterly average daily rate in hotels in Washington D.C. 2016-2017
- Basic Statistic Quarterly average daily rate of hotels in Atlanta 2016-2017
Other regions
9
- Premium Statistic Number of domestic and international overnight stays in hotels in Sweden 2018
- Premium Statistic Mexico: share of paid jobs in tourism by service type 2017
- Premium Statistic Number of overnight stays in hotels in the Faroe Islands 2019, by country of origin
- Basic Statistic Canary Islands: number of tourist bed places in 2019, by island
- Basic Statistic Accommodation and food services: GVA in the UK in 2010, by nation and region
- Premium Statistic Share of investments in tourism in Grand Est, France 2014-2016, by sector
- Premium Statistic Revenue of hotels per available hotel room in the Netherlands 2013-2018
- Premium Statistic Most popular accommodation types among domestic tourists in Denmark 2019
- Premium Statistic Number of holiday houses in Oslo, Norway 2009-2021
Related statistics
10
- Premium Statistic Number of Airbnb accommodations in Italy 2019, by region
- Basic Statistic Italy: cities with highest share of accommodations offering internet access 2018
- Premium Statistic Number of campsites and holiday villages in Italy 2010-2022
- Basic Statistic Domestic overnight stays in Belgium 2020, by accommodation type
- Premium Statistic Density of the regional hotel offer in Italy 2020
- Premium Statistic Average length of stay in hotels in Italy 2020, by hotel rating
- Premium Statistic Capacity of bed and breakfasts in Belgium 2012-2020
- Basic Statistic Capacity of campsites in Belgium 2013-2020
- Premium Statistic Number of hotels in Italy 2019-2020, by macro-region
- Basic Statistic Number of overnight stays in Belgium 2019-2022, by accommodation type
Further related statistics
10
- Foreign exchange earnings from tourism in India 2000-2022
- Extended stay lodging units: total number in the U.S. 2008-2016
- Private short-term rentals booked with Airbnb in New York City in 2010 and 2014
- Importance of BRICS countries to UK tourism businesses 2011
- International tourist arrivals in Europe 2006-2023
- Countries with the highest outbound tourism expenditure worldwide 2019-2022
- Countries with the highest number of inbound tourist arrivals worldwide 2019-2022
- Change in number of visitors from Mexico to the U.S. 2018-2024
- Factors affecting accommodation booking worldwide as of July 2016
- Growth of inbound spending in the U.S. using foreign visa credit cards
Further Content: You might find this interesting as well
Statistics
- Foreign exchange earnings from tourism in India 2000-2022
- Extended stay lodging units: total number in the U.S. 2008-2016
- Private short-term rentals booked with Airbnb in New York City in 2010 and 2014
- Importance of BRICS countries to UK tourism businesses 2011
- International tourist arrivals in Europe 2006-2023
- Countries with the highest outbound tourism expenditure worldwide 2019-2022
- Countries with the highest number of inbound tourist arrivals worldwide 2019-2022
- Change in number of visitors from Mexico to the U.S. 2018-2024
- Factors affecting accommodation booking worldwide as of July 2016
- Growth of inbound spending in the U.S. using foreign visa credit cards
Federazione delle Associazioni Italiane Alberghi e Turismo. (January 4, 2018). Distribution of hotel facilities in Italy in 2015, by macro-region [Graph]. In Statista. Retrieved April 19, 2024, from https://www.statista.com/statistics/794328/distribution-of-hotels-in-italy-by-macro-region/
Federazione delle Associazioni Italiane Alberghi e Turismo. "Distribution of hotel facilities in Italy in 2015, by macro-region." Chart. January 4, 2018. Statista. Accessed April 19, 2024. https://www.statista.com/statistics/794328/distribution-of-hotels-in-italy-by-macro-region/
Federazione delle Associazioni Italiane Alberghi e Turismo. (2018). Distribution of hotel facilities in Italy in 2015, by macro-region. Statista. Statista Inc.. Accessed: April 19, 2024. https://www.statista.com/statistics/794328/distribution-of-hotels-in-italy-by-macro-region/
Federazione delle Associazioni Italiane Alberghi e Turismo. "Distribution of Hotel Facilities in Italy in 2015, by Macro-region." Statista, Statista Inc., 4 Jan 2018, https://www.statista.com/statistics/794328/distribution-of-hotels-in-italy-by-macro-region/
Federazione delle Associazioni Italiane Alberghi e Turismo, Distribution of hotel facilities in Italy in 2015, by macro-region Statista, https://www.statista.com/statistics/794328/distribution-of-hotels-in-italy-by-macro-region/ (last visited April 19, 2024)
Distribution of hotel facilities in Italy in 2015, by macro-region [Graph], Federazione delle Associazioni Italiane Alberghi e Turismo, January 4, 2018. [Online]. Available: https://www.statista.com/statistics/794328/distribution-of-hotels-in-italy-by-macro-region/