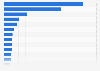
This statistic presents the most common actions taken by internet users in the United States after experiencing selected problems when viewing content on a device as of December 2017. According to the findings, the most common action taken by internet users with digital devices when experiencing problems viewing content was to stop altogether in viewing the content itself.
Actions taken by internet users in the United States after experiencing selected problems when viewing content on a device as of December 2017
Loading statistic...
Basic Account
Get to know the platform
You only have access to basic statistics.
Starter Account
The ideal entry-level account for individual users
- Instant access to 1m statistics
- Download in XLS, PDF & PNG format
- Detailed references
$199 USD / Month *
Professional Account
Full access
Business Solutions including all features.
* Prices do not include sales tax.
Other statistics that may interest you Statistics on
About the industry
10
- Basic Statistic Digital content access of internet users worldwide 2017, by device
- Basic Statistic Mexico: leading online activities 2023
- Basic Statistic Finding leisure-related information online in the UK 2021, by age group
- Basic Statistic UK: browsing and applying for job online in the UK 2021, by age group
- Premium Statistic Help French children get when creating a social media account for the first time 2020
- Premium Statistic Share of French parents knowing about their children's privacy on social media 2020
- Premium Statistic French children awareness about the privacy of their social media account(s) 2020
- Premium Statistic Mean age of realizing Internet activities according to French children 2020, by age
- Premium Statistic Types of Internet activities that French children carry out autonomously 2020, by age
- Premium Statistic Mean age of realizing Internet activities according to French parents 2020, by age
About the region
10
- Premium Statistic U.S. social media platform usage for video viewing 2017
- Basic Statistic U.S. internet users: Usage of cloud-based music/video services 2011
- Premium Statistic Share of consumers who watch connected TV weekly in the U.S. 2011-2021
- Premium Statistic Daily access TV content from the internet in the U.S. 2018-2020, by age
- Premium Statistic Share of countries hosting child pornography content deleted in France 2019
- Basic Statistic Leading U.S. media publishers on social media 2019, by video views
- Premium Statistic Engagement share of voice of U.S. brands 2019, by industry
- Premium Statistic U.S. generations: preferred donation channels used for charitable giving 2018
- Premium Statistic Share of Netflix time among total TV content viewing in the U.S. 2021-2023
- Premium Statistic Affluent American households: search engines most often used 2022
Selected statistics
3
Other regions
10
- Premium Statistic Areas in which the French follow the trends of influencers 2018
- Premium Statistic Inappropriate internet content encountered by pupils in Poland 2019, by type
- Premium Statistic Library size of Netflix in selected countries in Latin America 2023
- Premium Statistic Types of social sharing content in APAC 2014 by country or region
- Premium Statistic Change in digital media consumption in Finland 2019
- Premium Statistic People sharing media content online in Italy 2016, by age group
- Premium Statistic Netflix content availability 2016, by country
- Premium Statistic Share of individuals paying for online editorial content in Denmark 2019, by topic
- Premium Statistic Share of individuals paying for online editorial content in Norway 2019, by topic
- Premium Statistic Share of individuals paying for online editorial content in Sweden 2019, by topic
Related statistics
10
- Premium Statistic French parents' opinion on what children do autonomously online in 2020, by age
- Premium Statistic UK: finding information for educational or professional purposes online 2020
- Premium Statistic Looking at news websites or apps at least weekly in the UK 2014-2019, by age
- Premium Statistic Opinion on offensive content regulations, according to young French people 2019
- Basic Statistic Share of Internet users consuming music, movies or series online by age France 2019
- Basic Statistic Global internet user penetration 2014-2024
- Premium Statistic Share of individuals using the internet daily in Denmark 2022, by age group
- Premium Statistic Level of awareness of key cybercrime terms worldwide in 2019-2022
- Premium Statistic Outcomes for organizations after ransom payments worldwide 2023
- Premium Statistic Average daily internet and media use in Germany Q3 2022
Further related statistics
10
- Revenue of Sohu in China 2022, by segment
- Baidu's total revenue 2013-2023
- Netflix's annual revenue 2002-2023
- UK console gaming reach 2015-2022, by gender
- Households with internet access in GB from 2014 to 2020, by household composition
- Daily internet use penetration in Great Britain 2006-2020
- Change in B2C content marketing budgets North America 2020
- Internet usage on a mobile phone in Great Britain 2010-2019, by age
- Mobile internet use via laptops in Great Britain 2019, by demographic
- Average ADSL download speeds in the United Kingdom (UK) 2010-2017
Further Content: You might find this interesting as well
Statistics
- Revenue of Sohu in China 2022, by segment
- Baidu's total revenue 2013-2023
- Netflix's annual revenue 2002-2023
- UK console gaming reach 2015-2022, by gender
- Households with internet access in GB from 2014 to 2020, by household composition
- Daily internet use penetration in Great Britain 2006-2020
- Change in B2C content marketing budgets North America 2020
- Internet usage on a mobile phone in Great Britain 2010-2019, by age
- Mobile internet use via laptops in Great Britain 2019, by demographic
- Average ADSL download speeds in the United Kingdom (UK) 2010-2017
eMarketer. (February 9, 2018). Actions taken by internet users in the United States after experiencing selected problems when viewing content on a device as of December 2017 [Graph]. In Statista. Retrieved April 23, 2024, from https://www.statista.com/statistics/809922/us-internet-users-actions-taken-video-problems-device/
eMarketer. "Actions taken by internet users in the United States after experiencing selected problems when viewing content on a device as of December 2017." Chart. February 9, 2018. Statista. Accessed April 23, 2024. https://www.statista.com/statistics/809922/us-internet-users-actions-taken-video-problems-device/
eMarketer. (2018). Actions taken by internet users in the United States after experiencing selected problems when viewing content on a device as of December 2017. Statista. Statista Inc.. Accessed: April 23, 2024. https://www.statista.com/statistics/809922/us-internet-users-actions-taken-video-problems-device/
eMarketer. "Actions Taken by Internet Users in The United States after Experiencing Selected Problems When Viewing Content on a Device as of December 2017." Statista, Statista Inc., 9 Feb 2018, https://www.statista.com/statistics/809922/us-internet-users-actions-taken-video-problems-device/
eMarketer, Actions taken by internet users in the United States after experiencing selected problems when viewing content on a device as of December 2017 Statista, https://www.statista.com/statistics/809922/us-internet-users-actions-taken-video-problems-device/ (last visited April 23, 2024)
Actions taken by internet users in the United States after experiencing selected problems when viewing content on a device as of December 2017 [Graph], eMarketer, February 9, 2018. [Online]. Available: https://www.statista.com/statistics/809922/us-internet-users-actions-taken-video-problems-device/