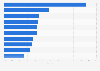
- Transportation & Logistics›
- Vehicles & Road Traffic›
Passenger car sales New Zealand 2005-2017
Industry-specific and extensively researched technical data (partially from exclusive partnerships).
A paid subscription is required for full access.
Passenger car sales New Zealand 2005-2017
Passenger car sales in New Zealand from 2005 to 2017 (in units)

Passenger car sales in New Zealand from 2005 to 2017 (in units)
Sales volume in units | |
---|---|
- | - |
- | - |
- | - |
- | - |
- | - |
- | - |
- | - |
- | - |
- | - |
- | - |
- | - |
- | - |
- | - |
Sales volume in units | |
---|---|
- | - |
- | - |
- | - |
- | - |
- | - |
- | - |
- | - |
- | - |
- | - |
- | - |
- | - |
- | - |
- | - |
You need a Premium Account for unlimited access.
Full access to 1m statistics
Incl. source references
Available to download in PNG, PDF, XLS format
You need a Premium Account for unlimited access.
Full access to 1m statistics
Incl. source references
Available to download in PNG, PDF, XLS format
© Statista 2019
About this statistic
Show source
Please be patient - this may take a moment
Description
Source
More information
- Show sources information
- Show publisher information
- Release date
- 2018
- Region
- New Zealand
- Survey time period
- 2005 to 2017
Source
- Show sources information
- Show publisher information
- Release date
- 2018
More information
- Region
- New Zealand
- Survey time period
- 2005 to 2017
Other statistics on the topic
Automotive IndustryYou only have access to basic statistics.
This statistic is not included in your account!
- Instant access to 1m statistics
- Download in XLS, PDF & PNG format
- Detailed references
$59 / Month *
Corporate solution including all features.
Prices do not include sales tax.


I think of Statista as Google for researchers. Statista provides you with the information you search for right away.Dr. Horst Stipp
EVP, Research & Innovation, Advertising Research Foundation
- Production
- Estimated worldwide automobile production from 2000 to 2018 (in million vehicles)Worldwide automobile production through 2018
- Estimated global vehicle production growth from 2013 to 2018, by regionChanges in worldwide vehicle production by region 2013-2018
- Estimated passenger car production in selected countries in 2018, by country (in million units)Passenger cars - major producing countries 2018
- Revenue of the leading automotive manufacturers worldwide in 2018 (in billion U.S. dollars)Revenue of the leading car manufacturers worldwide 2018
- Customers and sales
- Number of cars sold worldwide from 1990 to 2019 (in million units)Worldwide car sales 1990-2019
- Sales of passenger cars in selected countries worldwide from 2005 to 2018 (in million units)Passenger cars - sales in selected countries worldwide 2005-2018
- Largest automobile markets worldwide between January and December 2018, based on new car registrations (in 1,000s)Largest automobile markets - new car registrations December 2018 YTD
- Best-selling car and light truck models worldwide in 2018 (in 1,000 units)Best selling car and light truck models worldwide in 2018
- Manufacturers
- Leading automobile manufacturers worldwide in 2017 and 2018, based on total vehicle sales (in 1,000 units)Automobile manufacturers - vehicle sales worldwide 2017/2018
- Volkswagen AG's sales revenue from FY 2006 to FY 2018 (in billion euros)Volkswagen AG - sales revenue 2006-2018
- Volkswagen Group vehicle deliveries worldwide between 2017 and 2018, by key region (in 1,000 units)Number of Volkswagen Group deliveries sales by region 2017 & 2018
- Renault Group's revenue from FY 2010 to FY 2018 (in billion euros)Renault Group - revenue 2010-2018
- Renault Group's vehicle sales in FY 2018, by region (in 1,000 units)Regional vehicle sales of Renault Group 2018
- Toyota's net revenue from FY 2007 to FY 2019 (in billion Japanese yen)Toyota net revenue 2007 to 2019
- Toyota's motor vehicle sales between FY 2017 and FY 2019, by region (in 1,000s)Toyota motor vehicle sales by region 2017 to 2019
- Automotive suppliers
- The leading global automotive suppliers in 2018, based on revenue (in million euros)The leading global automotive suppliers based on revenue 2018
- The world's largest tire producers in 2018, based on tire-related sales (in billion U.S. dollars)Tire producers - based on global revenue 2018
- Bosch's revenue from FY 2000 to FY 2018 (in billion euros)Bosch - revenue 2000-2018
- Continental AG's revenue from FY 1999 to FY 2018 (in million euros)Continental AG's revenue 1999-2018
- Denso's global revenue from FY 2014 to FY 2019 (in million U.S. dollars)Denso - global revenue 2014-2019
- ZF Friedrichshafen AG's sales from FY 2009 to FY 2018 (in million euros)ZF Friedrichshafen AG sales 2009-2018
- Magna International's total sales between FY 2017 and FY 2018 (in million U.S. dollars)Magna: total sales 2017-2018
- The future of cars
- Global light vehicle production forecast from 2015 to 2023 (in million units)Global light vehicle production forecast 2015-2023
- Global automotive transmission type market share between 2010 and 2025Global automotive transmission outlook 2025
- Outlook on worldwide light vehicle sales from 2016 to 2024 (in million units)Worldwide light vehicle sales - outlook 2016-2024
- Projected autonomous vehicle sales worldwide in 2040, by country or region (in million units)Autonomous vehicle sales - globally by region 2040
- Passenger car sales Australia 2005-2017
- New vehicle sales Australia 2005-2017
- New vehicle sales New Zealand 2005-2018
- Major automobile manufacturers Vietnam 2018, by market share
- Used commercial vehicle sales in Spain in 2017, by segment
- Chile: leading passenger car brands 2018
- Workers in the sector of sale and repair of vehicles Spain 2008-2016
- Automobile industry sales in Germany from 2005 to 2018
- Sales volume of Saab cars in the Netherlands 1997-2014
- Sales volume of passenger vehicles manufactured in India - by carmaker 2018
- Passenger motor cars: share of retail trade turnover 1992-2017
- Chinese passenger vehicle sales by manufacturer 2015
- Share of passenger vehicle sales for new mobility services in China 2015-2025
- Commercial vehicle sales Australia 2005-2017
- Commercial vehicle sales New Zealand 2005-2017
- Commercial vehicle production Australia 2013-2017
- LPG and CNG vehicles in Spain as of September 2017
- Peru: commercial vehicle unit sales 2010-2018
- Bolivia: commercial vehicle unit sales 2010-2018
- Jamaica: commercial vehicle unit sales 2010-2018
- Automobile manufacturers - vehicle sales worldwide 2017/2018
- Volkswagen AG - sales revenue 2006-2018
- Number of Volkswagen Group deliveries sales by region 2017 & 2018
- Renault Group - revenue 2010-2018
- Regional vehicle sales of Renault Group 2018
- Toyota net revenue 2007 to 2019
- Toyota motor vehicle sales by region 2017 to 2019
- Passenger car sales Australia 2005-2017
- New vehicle sales Australia 2005-2017
- New vehicle sales New Zealand 2005-2018
- Major automobile manufacturers Vietnam 2018, by market share
- Used commercial vehicle sales in Spain in 2017, by segment
- Chile: leading passenger car brands 2018
- Workers in the sector of sale and repair of vehicles Spain 2008-2016
- Automobile industry sales in Germany from 2005 to 2018
- Sales volume of Saab cars in the Netherlands 1997-2014
- Sales volume of passenger vehicles manufactured in India - by carmaker 2018
- Passenger motor cars: share of retail trade turnover 1992-2017
- Chinese passenger vehicle sales by manufacturer 2015
- Share of passenger vehicle sales for new mobility services in China 2015-2025
- Commercial vehicle sales Australia 2005-2017
- Commercial vehicle sales New Zealand 2005-2017
- Commercial vehicle production Australia 2013-2017
- LPG and CNG vehicles in Spain as of September 2017
- Peru: commercial vehicle unit sales 2010-2018
- Bolivia: commercial vehicle unit sales 2010-2018
- Jamaica: commercial vehicle unit sales 2010-2018
Statista offers dossiers and reports on over 170 industries. With Statista you are always able to make informed decisions and boost your work efficiency.
- Social Media
- E-Commerce
- Online Video & Entertainment
- Advertising & Marketing
- Alcoholic Beverages
- Cleaning Products
- Cosmetics & Personal Care
- Food & Nutrition
- Health & Hygiene
- International Trade
- Shopping Behavior
- Sports & Leisure
- Business Travel
- Leisure Travel
- Accomodation
- Restaurants
- Demographics
- Economy
- Education & Science
- Politics & Government
- Aviation
- Rail Transport
- Vehicles & Road Traffic
- Water Transport
You can only download this statistic as a Premium user.
As a Premium user you get access to the detailed source references and background information about this statistic.
As a Premium user you get access to background information and details about the release of this statistic.
As soon as this statistic is updated, you will immediately be notified via e-mail.
...and make my research life easier.
You need at least a Premium Account to use this feature.
This feature is limited to our corporate solutions.
Please contact us to get started with full access to dossiers, forecasts, studies and international data.
We use cookies to personalize contents and ads, offer social media features, and analyze access to our website. In your browser settings you can configure or disable this, respectively, and can delete any already placed cookies. For details, please see your browser’s Help section (by pressing F1). Please see our privacy statement for details about how we use data.