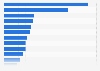
Chocolate consumption frequency in Belgium 2018

Chocolate consumption frequency in Belgium in 2018*

Download
Show detailed source information?
Register for free
Already a member?
Log in
Sources

Use Ask Statista Research Service

Release date

April 2018

Region

Belgium

Survey time period

March 6, 2018 to March 14, 2018

Number of respondents

1,002 respondents

Age group

18-75 years

Special properties

respondents who consume chocolate at least once a month

Method of interview

Online survey

Supplementary notes

* The source does not provide information on the original wording used during the survey. Thus, the wording chosen for this statistic may differ slightly from the one in the survey.

Citation formats
Statista Accounts: Access All Statistics. Starting from $2,388 USD / Year
Basic Account
Get to know the platform

You only have access to basic statistics.
This statistic is not included in your account.

Starter Account
The ideal entry-level account for individual users
  • Instant access to 1m statistics
  • Download in XLS, PDF & PNG format
  • Detailed references
$199 USD / Month *
Professional Account
Full access

Business Solutions including all features.

* Prices do not include sales tax.

Statistics on " Confectionery market in Belgium "

Other statistics that may interest you Confectionery market in Belgium

Confectionery industry

3

Confectionery consumption

6

Confectionery types

8

Trade in confectionery

4

Further related statistics

18
Statista Accounts: Access All Statistics. Starting from $2,388 USD / Year
Learn more about how Statista can support your business.