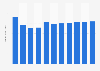
This statistic shows the export volume of coffee in Australia from 2008 to 2013. In 2013, the export volume of coffee exported from Australia reached around 21 thousand metric tons.
Volume of coffee exported from Australia from 2008 to 2013 (in thousand metric tons)
Basic Account
Get to know the platform
You only have access to basic statistics.
This statistic is not included in your account.
Starter Account
The ideal entry-level account for individual users
- Instant access to 1m statistics
- Download in XLS, PDF & PNG format
- Detailed references
$199 USD / Month *
Professional Account
Full access
Business Solutions including all features.
* Prices do not include sales tax.
Other statistics that may interest you Statistics on
About the industry
10
- Premium Statistic Export value of decaffeinated or roasted coffee APAC 2021, by country
- Premium Statistic Export value of cucumbers and gherkins APAC 2020, by country
- Premium Statistic Export value of apricots APAC 2020, by country
- Premium Statistic Export value of bread APAC 2020, by country
- Premium Statistic Export value of dates APAC 2020, by country
- Premium Statistic Export value of asparagus APAC 2020, by country
- Premium Statistic Export value of cauliflower and broccoli APAC 2020, by country
- Premium Statistic Export value of avocados APAC 2020, by country
- Premium Statistic Export value of ginger APAC 2020, by country
- Premium Statistic Export value of bananas APAC 2020, by country
About the region
10
- Premium Statistic Domestic supply of coffee Australia 2008-2013
- Premium Statistic Annual growth in Australian wine exports FY 2010- FY 2023
- Basic Statistic French agri-food exports to Asian and Oceanian countries in 2018
- Premium Statistic Total value of Australian wine exports FY 2009- FY 2023
- Premium Statistic Employment created by the CPP industry Australia FY 2016 by type
- Premium Statistic Market share of the CPP sector in Australia 2016 by segment
- Premium Statistic Land area for barley production in Australia FY 2010-2024
- Premium Statistic Land area for wheat production in Australia FY 2010-2024
- Premium Statistic Land area for oat production Australia FY 2010-2024
- Premium Statistic Forestry plantation area Australia FY 2010-2022
Selected statistics
4
Other regions
10
- Premium Statistic Export value of cider APAC 2021, by country
- Premium Statistic Export value of eggplants APAC 2020, by country
- Premium Statistic Main export partners of Sweden for rice 2019
- Premium Statistic Monthly export value of olive oil from Tunisia 2020, by country of destination
- Premium Statistic Import share of agricultural raw materials in Morocco 2010-2020
- Premium Statistic Import share of agricultural raw materials in Ghana 2012-2019
- Premium Statistic Italy: export share of Italian espresso coffee machine 2018, by geographical area
- Premium Statistic Export volume of fresh chicken eggs from Norway 2012-2019
- Premium Statistic Export volume forecast of soybean oil worldwide 2022/23-2033/34, by country
- Premium Statistic Principal agricultural exports GDP share Philippines 2009-2018
Related statistics
10
- Premium Statistic Wine export value Australia 2023, by price point
- Premium Statistic Wine exports by type in Australia FY 2021
- Premium Statistic Wine exports Australia FY 2021, by country
- Premium Statistic Export volume of wine Australia FY 2011-2024
- Premium Statistic Consumption of poultry Australia 2015-2031
- Premium Statistic Consumption of sheep meat Australia 2015-2031
- Premium Statistic Consumption of beef and veal Australia 2015-2031
- Premium Statistic Consumption of pork Australia 2015-2031
- Premium Statistic Consumption of meat Australia 2013-2021, by type
- Premium Statistic Wine export value Australia 2018 by price segment
Further related statistics
10
- Caribou Coffee net income 2011
- Caribou Coffee total assets 2011
- Caribou Coffee total annual revenue 2011
- U.S. total apple production 2000-2022
- BayWa's revenue by segment 2010-2022
- Total U.S. domestic grain use 2001-2023
- Bunge Limited's total assets 2007-2023
- Total U.S. wheat area planted and harvested 2001-2023
- Area of corn for grain harvested in the U.S. 2001-2023
- Corn for grain production in the U.S. 2001-2023
Further Content: You might find this interesting as well
Statistics
- Caribou Coffee net income 2011
- Caribou Coffee total assets 2011
- Caribou Coffee total annual revenue 2011
- U.S. total apple production 2000-2022
- BayWa's revenue by segment 2010-2022
- Total U.S. domestic grain use 2001-2023
- Bunge Limited's total assets 2007-2023
- Total U.S. wheat area planted and harvested 2001-2023
- Area of corn for grain harvested in the U.S. 2001-2023
- Corn for grain production in the U.S. 2001-2023
FAO. (December 12, 2017). Volume of coffee exported from Australia from 2008 to 2013 (in thousand metric tons) [Graph]. In Statista. Retrieved April 20, 2024, from https://www.statista.com/statistics/868962/australia-coffee-export-volume/
FAO. "Volume of coffee exported from Australia from 2008 to 2013 (in thousand metric tons)." Chart. December 12, 2017. Statista. Accessed April 20, 2024. https://www.statista.com/statistics/868962/australia-coffee-export-volume/
FAO. (2017). Volume of coffee exported from Australia from 2008 to 2013 (in thousand metric tons). Statista. Statista Inc.. Accessed: April 20, 2024. https://www.statista.com/statistics/868962/australia-coffee-export-volume/
FAO. "Volume of Coffee Exported from Australia from 2008 to 2013 (in Thousand Metric Tons)." Statista, Statista Inc., 12 Dec 2017, https://www.statista.com/statistics/868962/australia-coffee-export-volume/
FAO, Volume of coffee exported from Australia from 2008 to 2013 (in thousand metric tons) Statista, https://www.statista.com/statistics/868962/australia-coffee-export-volume/ (last visited April 20, 2024)
Volume of coffee exported from Australia from 2008 to 2013 (in thousand metric tons) [Graph], FAO, December 12, 2017. [Online]. Available: https://www.statista.com/statistics/868962/australia-coffee-export-volume/