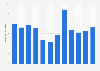
This statistic shows the sales revenue of the soft drink manufacturing industry in China from 2012 to 2016. In 2016, the revenues of soft drink production in China amounted to approximately 0.64 trillion yuan.
Sales revenue of the soft drink manufacturing industry in China from 2012 to 2016 (in trillion yuan)
Basic Account
Get to know the platform
You only have access to basic statistics.
This statistic is not included in your account.
Starter Account
The ideal entry-level account for individual users
- Instant access to 1m statistics
- Download in XLS, PDF & PNG format
- Detailed references
$199 USD / Month *
Professional Account
Full access
Business Solutions including all features.
* Prices do not include sales tax.
Other statistics that may interest you Statistics on
About the industry
10
- Basic Statistic Share of non-alcoholic beverages in retail sales in Hungary 2015-2023
- Premium Statistic Italy: value of non-alcoholic beverages worldwide exports 2012-2022
- Premium Statistic Italy: value of non-alcoholic beverages worldwide imports 2012-2022
- Premium Statistic Italy: volume of non-alcoholic beverages worldwide imports 2012-2022
- Premium Statistic Leading soft drinks in the United Kingdom 2022, by high street sales value
- Premium Statistic Leading soft drinks in the United Kingdom 2022, by high street sales volume
- Premium Statistic Global consumption of packed beverages 2023, by beverage type
- Premium Statistic U.S. sales value growth of non-alcoholic beverages 2023, by segment
- Premium Statistic Weekly consumption of soft drinks outside the home in the United Kingdom 2006-2021
- Premium Statistic Brazil: non-alcoholic beverage production volume 2018-2021
About the region
10
- Premium Statistic Non-alcoholic beverage consumption in China 2011-2021
- Premium Statistic Manufacturing purchasing managers index (PMI) Hong Kong 2022-2024
- Premium Statistic Manufacturing Purchasing Managers' Index (PMI) in China by month March 2024
- Premium Statistic Manufacturing PMI related indices in China 2022-2024
- Premium Statistic China: revenue of the soft drink market 2014-2027, by type
- Premium Statistic China: revenue of non-alcoholic drinks 2014-2027, by type
- Premium Statistic Non-alcoholic drink monthly production in China 2023-2024
- Premium Statistic Share of public and private sector in GDP of Shanghai, China 2012-2022
- Premium Statistic Value added to GDP of Shanghai, China 2022, by industry
- Premium Statistic Annual change of industrial production in China 2013-2023
Other regions
9
- Basic Statistic Global beverage market: leading companies 2022, based on sales
- Premium Statistic Breweries' domestic soft drinks and soda sales in Finland 2007-2017 by packaging
- Premium Statistic Latin America: sugar-sweetened beverages sales 2017, by country
- Premium Statistic Average retail price for cola type soft drinks in Canada 2014-2019
- Premium Statistic Forecast: revenue soft drink manufacture Lithuania 2008-2020
- Premium Statistic Colombia: per capita expenditure on mineral water, soft drinks & juices 2013-2017
- Premium Statistic Chile: healthy soft drinks sales value 2011-2016
- Premium Statistic Regional market volume growth of the soft drinks industry in India 2010-2015
- Premium Statistic Mexico: non-alcoholic beverage consumption 2011-2021
Related statistics
8
- Premium Statistic Retail sales value of soft beverages in China 2020-2025, by type
- Premium Statistic Share of carbonated beverage market in China 2019, by company
- Premium Statistic Market share of non-alcoholic drinks in China 2019, by enterprise
- Premium Statistic Retail sales value of non-alcoholic beverages in China 2019-2024, by sales channel
- Premium Statistic Alcoholic soft drinks retail sales value in China 2013-2022
- Premium Statistic Dark rum retail sales value in China 2013-2022
- Premium Statistic Most popular soft drink brands in tier-1 cities in China 2015
- Premium Statistic Retail sales value of carbonated beverages in China 2009-2019
Further related statistics
10
- Market share of the Dr Pepper brand in the U.S. 2008-2022
- Market share of the Sprite brand in the U.S. 2008-2022
- Market share of the Diet Dr Pepper brand in the U.S. 2008-2022
- Keurig Dr Pepper company's market share in the U.S. 2008-2022
- National Beverage company's market share in the U.S. 2009-2022
- Market share of the Coke Classic brand in the U.S. 2008-2022
- Market share of the Diet Coke brand in the U.S. 2008-2022
- Refresco company's market share in the U.S. 2004-2020
- Consumers' likelihood of choosing soft drinks in the UK 2012, by gender
- Soft drinks: Consumption of carbonated drinks in the United Kingdom 2013-2022
Further Content: You might find this interesting as well
Statistics
- Market share of the Dr Pepper brand in the U.S. 2008-2022
- Market share of the Sprite brand in the U.S. 2008-2022
- Market share of the Diet Dr Pepper brand in the U.S. 2008-2022
- Keurig Dr Pepper company's market share in the U.S. 2008-2022
- National Beverage company's market share in the U.S. 2009-2022
- Market share of the Coke Classic brand in the U.S. 2008-2022
- Market share of the Diet Coke brand in the U.S. 2008-2022
- Refresco company's market share in the U.S. 2004-2020
- Consumers' likelihood of choosing soft drinks in the UK 2012, by gender
- Soft drinks: Consumption of carbonated drinks in the United Kingdom 2013-2022
AskCI Consulting, & Website (zhuanlan.zhihu.com). (August 15, 2017). Sales revenue of the soft drink manufacturing industry in China from 2012 to 2016 (in trillion yuan) [Graph]. In Statista. Retrieved April 18, 2024, from https://www.statista.com/statistics/872025/china-soft-drink-manufacturing-revenue/
AskCI Consulting, und Website (zhuanlan.zhihu.com). "Sales revenue of the soft drink manufacturing industry in China from 2012 to 2016 (in trillion yuan)." Chart. August 15, 2017. Statista. Accessed April 18, 2024. https://www.statista.com/statistics/872025/china-soft-drink-manufacturing-revenue/
AskCI Consulting, Website (zhuanlan.zhihu.com). (2017). Sales revenue of the soft drink manufacturing industry in China from 2012 to 2016 (in trillion yuan). Statista. Statista Inc.. Accessed: April 18, 2024. https://www.statista.com/statistics/872025/china-soft-drink-manufacturing-revenue/
AskCI Consulting, and Website (zhuanlan.zhihu.com). "Sales Revenue of The Soft Drink Manufacturing Industry in China from 2012 to 2016 (in Trillion Yuan)." Statista, Statista Inc., 15 Aug 2017, https://www.statista.com/statistics/872025/china-soft-drink-manufacturing-revenue/
AskCI Consulting & Website (zhuanlan.zhihu.com), Sales revenue of the soft drink manufacturing industry in China from 2012 to 2016 (in trillion yuan) Statista, https://www.statista.com/statistics/872025/china-soft-drink-manufacturing-revenue/ (last visited April 18, 2024)
Sales revenue of the soft drink manufacturing industry in China from 2012 to 2016 (in trillion yuan) [Graph], AskCI Consulting, & Website (zhuanlan.zhihu.com), August 15, 2017. [Online]. Available: https://www.statista.com/statistics/872025/china-soft-drink-manufacturing-revenue/