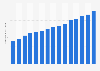
The statistic shows the fresh cut flower production value in Yunnan province of China from 2012 to 2016. In 2016, the total value of fresh cut flowers produced in Yunnan of China amounted to around 6.86 billion yuan.
Fresh cut flower production value in Yunnan province of China from 2012 to 2016 (in billion yuan)
Basic Account
Get to know the platform
You only have access to basic statistics.
This statistic is not included in your account.
Starter Account
The ideal entry-level account for individual users
- Instant access to 1m statistics
- Download in XLS, PDF & PNG format
- Detailed references
$199 USD / Month *
Professional Account
Full access
Business Solutions including all features.
* Prices do not include sales tax.
Other statistics that may interest you Statistics on
About the industry
10
- Premium Statistic Flower farmers' income in Yunnan China 2011-2016
- Premium Statistic Distribution of Flowerplus users in China 2018, by age group
- Premium Statistic Sunflower seed production in China 2010-2014
- Premium Statistic Oleiferous plant production in China 2012-2022
- Premium Statistic Rice production in China 2013-2023
- Premium Statistic Corn production in China 2013-2023
- Premium Statistic Wheat production in China 2013-2023
- Premium Statistic Apple production in China 2022, by region
- Premium Statistic Citrus fruit production in China 2022, by region
- Premium Statistic Wheat production in China in 2022, by region
About the region
10
- Premium Statistic Grape production in China 2022, by region
- Premium Statistic Bean production in China 2012-2022
- Premium Statistic Tuber production in China 2022, by region
- Premium Statistic Rapeseed production in China 2022, by region
- Premium Statistic Banana production in China 2022, by region
- Premium Statistic Peanut production in China by region 2022
- Premium Statistic Cereal production 2022, by region
- Premium Statistic Sesame production in China 2022, by region
- Premium Statistic Cotton production in China 2022, by region
- Premium Statistic Sugarcane production in China 2022, by region
Selected statistics
10
- Premium Statistic Grape production in China 2000-2022
- Premium Statistic Corn for grain production in the U.S. 2001-2023
- Premium Statistic U.S. total apple production 2000-2022
- Basic Statistic Total U.S. domestic grain use 2001-2023
- Basic Statistic Total U.S. wheat area planted and harvested 2001-2023
- Premium Statistic Area of corn for grain harvested in the U.S. 2001-2023
- Premium Statistic Cotton yield per harvested acre in the U.S. 2001-2023
- Basic Statistic Syngenta's sales in the crop protection segment worldwide 2013-2022
- Premium Statistic Brazil: land area use share by type 2010-2020
- Premium Statistic Crop values in the United States 2015-2020
Other regions
10
- Premium Statistic Number of bulbgrowing companies in the Netherlands 2007-2022
- Premium Statistic Production value of rice in South Korea 2010-2022
- Premium Statistic Estimated production volume of tea across India 2023, by state
- Basic Statistic Harvested area of almonds in Spain 2010-2016
- Premium Statistic Uruguay: corn production 2011-2019
- Premium Statistic Organic agricultural land area in Tunisia 2019, by crop type
- Basic Statistic Harvested area of grapes for wines in Italy 2008-2022
- Premium Statistic Peanut production in Taiwan 2012-2022
- Premium Statistic Import of barley into Algeria 2017-2022
- Premium Statistic Yearly crop yield of tobacco produced in France from 2010 to 2020
Related statistics
10
- Premium Statistic Corn production 2022, by region
- Premium Statistic Bean production in China 2022, by region
- Premium Statistic Sugar beet production in China 2022, by region
- Premium Statistic Tobacco production in China 2022, by region
- Premium Statistic Tea production in China 2022, by region
- Premium Statistic Fruit production in China 2022, by region
- Premium Statistic Pear production in China 2022, by region
- Premium Statistic Rice production in China 2022, by region
- Premium Statistic Cotton acreage in China 2013-2023
- Premium Statistic Acreage of rice in China 2013-2023
Further related statistics
10
- Net sales of AGCO 2010-2022
- BayWa's revenue by segment 2010-2022
- Bunge Limited's total assets 2007-2023
- Archer Daniels Midland's revenue 2006-2022
- AGCO's number of employees 2006-2021
- Syngenta AG's number of employees worldwide 2011-2016
- Glencore's net income 2010-2023
- CF Industries' revenue 2010-2022
- Area of organic farming worldwide 2000-2022
- Grape crush volume share in California for the production of wine 2022, by variety
Further Content: You might find this interesting as well
Statistics
- Net sales of AGCO 2010-2022
- BayWa's revenue by segment 2010-2022
- Bunge Limited's total assets 2007-2023
- Archer Daniels Midland's revenue 2006-2022
- AGCO's number of employees 2006-2021
- Syngenta AG's number of employees worldwide 2011-2016
- Glencore's net income 2010-2023
- CF Industries' revenue 2010-2022
- Area of organic farming worldwide 2000-2022
- Grape crush volume share in California for the production of wine 2022, by variety
iResearch. (May 7, 2018). Fresh cut flower production value in Yunnan province of China from 2012 to 2016 (in billion yuan) [Graph]. In Statista. Retrieved April 20, 2024, from https://www.statista.com/statistics/880524/china-fresh-flowers-production-value-in-yunnan/
iResearch. "Fresh cut flower production value in Yunnan province of China from 2012 to 2016 (in billion yuan)." Chart. May 7, 2018. Statista. Accessed April 20, 2024. https://www.statista.com/statistics/880524/china-fresh-flowers-production-value-in-yunnan/
iResearch. (2018). Fresh cut flower production value in Yunnan province of China from 2012 to 2016 (in billion yuan). Statista. Statista Inc.. Accessed: April 20, 2024. https://www.statista.com/statistics/880524/china-fresh-flowers-production-value-in-yunnan/
iResearch. "Fresh Cut Flower Production Value in Yunnan Province of China from 2012 to 2016 (in Billion Yuan)." Statista, Statista Inc., 7 May 2018, https://www.statista.com/statistics/880524/china-fresh-flowers-production-value-in-yunnan/
iResearch, Fresh cut flower production value in Yunnan province of China from 2012 to 2016 (in billion yuan) Statista, https://www.statista.com/statistics/880524/china-fresh-flowers-production-value-in-yunnan/ (last visited April 20, 2024)
Fresh cut flower production value in Yunnan province of China from 2012 to 2016 (in billion yuan) [Graph], iResearch, May 7, 2018. [Online]. Available: https://www.statista.com/statistics/880524/china-fresh-flowers-production-value-in-yunnan/