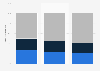
This statistic illustrates the user distribution of an e-commerce platform Flowerplus in China in 2018, by city tier. During the measured time period, around 48 percent of Flowerplus users in China were based in first-tier cities.
User distribution of an e-commerce platform Flowerplus in China in 2018, by city tier*
Basic Account
Get to know the platform
You only have access to basic statistics.
This statistic is not included in your account.
Starter Account
The ideal entry-level account for individual users
- Instant access to 1m statistics
- Download in XLS, PDF & PNG format
- Detailed references
$199 USD / Month *
Professional Account
Full access
Business Solutions including all features.
* Prices do not include sales tax.
Other statistics that may interest you Statistics on
About the industry
9
- Premium Statistic Distribution of Flowerplus users in China 2018, by age group
- Premium Statistic Share of flowers bought by online consumers in China 1H 2017 by flowering season
- Premium Statistic Share of internet users in China using subscription bouquet services H1 2017
- Premium Statistic Reasons for Millennials to buy flowers online in the Netherlands 2020
- Basic Statistic United Kingdom: Top 10 food & beverages online stores 2023
- Basic Statistic Top food & beverages online stores in the U.S. in 2023
- Premium Statistic Germany: Top 10 Food & Beverages online stores 2022
- Premium Statistic Use of delivery or order collection by plant buyers during containment in France 2020
- Premium Statistic Common online channels used by Chinese to buy presents 2016, by share of HNWIs
About the region
10
- Premium Statistic Flower farmers' income in Yunnan China 2011-2016
- Premium Statistic Grape production in China 2022, by region
- Premium Statistic Oleiferous plant production in China 2012-2022
- Premium Statistic Corn production in China 2013-2023
- Premium Statistic Wheat production in China 2013-2023
- Premium Statistic Rice production in China 2013-2023
- Premium Statistic Bean production in China 2012-2022
- Premium Statistic Sesame production in China 2022, by region
- Premium Statistic Sugarcane production in China 2022, by region
- Premium Statistic Banana production in China 2022, by region
Other regions
10
- Premium Statistic Estimated production volume of tea across India 2023, by state
- Basic Statistic Harvested area of grapes for wines in Italy 2008-2022
- Premium Statistic Avocados: commercial production in the U.S. 2013-2022
- Basic Statistic Harvested area of almonds in Spain 2010-2016
- Premium Statistic Uruguay: corn production 2011-2019
- Premium Statistic Organic agricultural land area in Tunisia 2019, by crop type
- Premium Statistic Number of fruit farms in the Netherlands 2007-2021
- Premium Statistic Total land area used for crops in the United Kingdom (UK) 2003-2022
- Premium Statistic Import of barley into Algeria 2017-2022
- Premium Statistic Peanut production in Taiwan 2012-2022
Related statistics
10
- Premium Statistic Monthly rice imports in China 2022-2023
- Premium Statistic Monthly wheat imports in China 2022-2023
- Premium Statistic Monthly corn imports in China 2021-2023
- Premium Statistic Monthly soybean imports in China 2023-2024
- Premium Statistic Value of annual wheat imports to China 2012-2022
- Premium Statistic China's annual wheat import volume 2012-2022
- Premium Statistic Total rice consumption in China MY 2012/13-2023/24
- Premium Statistic Consumer agricultural product import value in Macao 2020, by country or region
- Premium Statistic Consumer agricultural product import value distribution in Macao 2020, by country
- Premium Statistic Consumer agricultural product export value in Macao 2015-2020
Further related statistics
10
- Grape production in China 2000-2022
- Corn for grain production in the U.S. 2001-2023
- Net sales of AGCO 2010-2022
- U.S. total apple production 2000-2022
- Total U.S. domestic grain use 2001-2023
- Total U.S. wheat area planted and harvested 2001-2023
- Area of corn for grain harvested in the U.S. 2001-2023
- Cotton yield per harvested acre in the U.S. 2001-2023
- BayWa's revenue by segment 2010-2022
- Syngenta's sales in the crop protection segment worldwide 2013-2022
Further Content: You might find this interesting as well
Statistics
- Grape production in China 2000-2022
- Corn for grain production in the U.S. 2001-2023
- Net sales of AGCO 2010-2022
- U.S. total apple production 2000-2022
- Total U.S. domestic grain use 2001-2023
- Total U.S. wheat area planted and harvested 2001-2023
- Area of corn for grain harvested in the U.S. 2001-2023
- Cotton yield per harvested acre in the U.S. 2001-2023
- BayWa's revenue by segment 2010-2022
- Syngenta's sales in the crop protection segment worldwide 2013-2022
iResearch. (May 7, 2018). User distribution of an e-commerce platform Flowerplus in China in 2018, by city tier* [Graph]. In Statista. Retrieved April 23, 2024, from https://www.statista.com/statistics/880805/china-users-of-chinese-e-commerce-platform-flowerplus-by-city-tier/
iResearch. "User distribution of an e-commerce platform Flowerplus in China in 2018, by city tier*." Chart. May 7, 2018. Statista. Accessed April 23, 2024. https://www.statista.com/statistics/880805/china-users-of-chinese-e-commerce-platform-flowerplus-by-city-tier/
iResearch. (2018). User distribution of an e-commerce platform Flowerplus in China in 2018, by city tier*. Statista. Statista Inc.. Accessed: April 23, 2024. https://www.statista.com/statistics/880805/china-users-of-chinese-e-commerce-platform-flowerplus-by-city-tier/
iResearch. "User Distribution of An E-commerce Platform Flowerplus in China in 2018, by City Tier*." Statista, Statista Inc., 7 May 2018, https://www.statista.com/statistics/880805/china-users-of-chinese-e-commerce-platform-flowerplus-by-city-tier/
iResearch, User distribution of an e-commerce platform Flowerplus in China in 2018, by city tier* Statista, https://www.statista.com/statistics/880805/china-users-of-chinese-e-commerce-platform-flowerplus-by-city-tier/ (last visited April 23, 2024)
User distribution of an e-commerce platform Flowerplus in China in 2018, by city tier* [Graph], iResearch, May 7, 2018. [Online]. Available: https://www.statista.com/statistics/880805/china-users-of-chinese-e-commerce-platform-flowerplus-by-city-tier/