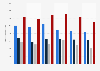
This statistic shows the results of a survey conducted from February to June 2018 among adult Americans on their preferred brands of dog food. The results were sorted by recent purchases based on quality. During the survey, 15.6 percent of respondents prefer to buy Blue Buffalo based on higher quality; 13.2 percent of respondents stated they prefer to buy Blue Buffalo not based on higher quality.
United States: Brand preferences for dry dog food from February through June 2018, by recent purchase based on quality
Basic Account
Get to know the platform
You only have access to basic statistics.
This statistic is not included in your account.
Starter Account
The ideal entry-level account for individual users
- Instant access to 1m statistics
- Download in XLS, PDF & PNG format
- Detailed references
$199 USD / Month *
Professional Account
Full access
Business Solutions including all features.
* Prices do not include sales tax.
Other statistics that may interest you Statistics on
About the industry
9
- Premium Statistic Dry dog food brand preferences in the U.S. from September to November 2017, by gender
- Premium Statistic Dog food usage in France 2014-2020, by brand type
- Premium Statistic Online pet product categories in France in 2020, by share of supply
- Basic Statistic Retail market share dog food India 2021, by company
- Basic Statistic Retail market share of dog food India 2017 by brand
- Premium Statistic Average spend per year on small pet dogs in the United Kingdom (UK) in 2017
- Premium Statistic Average spend per year on medium pet dogs in the United Kingdom (UK) in 2017
- Premium Statistic Average spend per year on large pet dogs in the United Kingdom (UK) in 2017
- Premium Statistic Average spend per year on pet dogs in the United Kingdom (UK) in 2016
About the region
10
- Premium Statistic Share of dog food purchase in the United States in 2016, by food type
- Premium Statistic Dry dog food: sales of leading vendors in the U.S. 2022
- Premium Statistic Sales growth of leading dog treat brands on Amazon in the United States 2020
- Premium Statistic Americans' preferred men's athletic shoe brands 2018, based on quality
- Premium Statistic Americans' preferred laptop computer brands 2018, based on special offer or sale
- Premium Statistic Americans' preferred big box retailers from February to June 2018, based on price
- Premium Statistic Americans' preferred quick serve restaurants February to June 2018, based on price
- Premium Statistic American women' s preferred facial moisturizer brands 2018, based on quality
- Premium Statistic Americans' preferred big box retailers from February to April 2018, based on loyalty
- Premium Statistic Americans' preferred midsize sedans from February to April 2018, based on loyalty
Other regions
10
- Basic Statistic Leading dog food brands in Canada 2010, by retail value share
- Premium Statistic Global leading cat and dog food exporting countries based on volume 2022
- Premium Statistic Forecasted CAGR of dog food retail sales in China 2022-2026, by product category
- Premium Statistic Mexico: largest dog food producers 2017
- Premium Statistic Leading pet food brands in the United Kingdom (UK) 2011, by market share
- Premium Statistic Dog and pet food sales volume in Italy 2012-2022
- Premium Statistic Chile: largest pet food digital advertisers 2019
- Premium Statistic Survey on reasons for pets suffering from obesity in Sweden 2016
- Basic Statistic Pet ownership in selected countries in Europe in 2016
- Premium Statistic Argentina: largest dog food producers 2017
Related statistics
10
- Premium Statistic Americans' preferred smartphones from February to April 2018, based on loyalty
- Premium Statistic Americans' preferred vodka from February to April 2018, based on loyalty
- Premium Statistic Americans' preferred airlines from February to April 2018, based on loyalty
- Premium Statistic Hotel brand preferences in the U.S. in 2017 and 2018, by ethnicity
- Premium Statistic Energy drink brand preferences in the U.S. in 2017 and 2018, by age
- Premium Statistic Americans' preferred laptop brand by household type 2017 / 2018
- Premium Statistic Americans' brand preference for salty snacks in 2017 and 2018, by gender
- Premium Statistic Americans' brand preference for energy and nutrition bars in 2017 and 2018, by gender
- Premium Statistic Americans' brand preference for yogurt in 2017 and 2018, by gender
- Premium Statistic Big box retailers brand preferences in the U.S. from 2017 to 2018, by income
Further related statistics
6
- Cities with the most off-leash dog parks per 100,000 residents in the U.S. 2022
- Market share of the Coke Classic brand in the U.S. 2008-2022
- Market share of the Diet Coke brand in the U.S. 2008-2022
- Market share of the Dr Pepper brand in the U.S. 2008-2022
- Market share of the Sprite brand in the U.S. 2008-2022
- Market share of the Diet Dr Pepper brand in the U.S. 2008-2022
Further Content: You might find this interesting as well
Statistics
- Cities with the most off-leash dog parks per 100,000 residents in the U.S. 2022
- Market share of the Coke Classic brand in the U.S. 2008-2022
- Market share of the Diet Coke brand in the U.S. 2008-2022
- Market share of the Dr Pepper brand in the U.S. 2008-2022
- Market share of the Sprite brand in the U.S. 2008-2022
- Market share of the Diet Dr Pepper brand in the U.S. 2008-2022
The Brand Strength Monitor. (July 31, 2018). United States: Brand preferences for dry dog food from February through June 2018, by recent purchase based on quality [Graph]. In Statista. Retrieved April 19, 2024, from https://www.statista.com/statistics/888704/us-brand-preferences-for-dry-dog-food-based-on-quality/
The Brand Strength Monitor. "United States: Brand preferences for dry dog food from February through June 2018, by recent purchase based on quality." Chart. July 31, 2018. Statista. Accessed April 19, 2024. https://www.statista.com/statistics/888704/us-brand-preferences-for-dry-dog-food-based-on-quality/
The Brand Strength Monitor. (2018). United States: Brand preferences for dry dog food from February through June 2018, by recent purchase based on quality. Statista. Statista Inc.. Accessed: April 19, 2024. https://www.statista.com/statistics/888704/us-brand-preferences-for-dry-dog-food-based-on-quality/
The Brand Strength Monitor. "United States: Brand Preferences for Dry Dog Food from February through June 2018, by Recent Purchase Based on Quality." Statista, Statista Inc., 31 Jul 2018, https://www.statista.com/statistics/888704/us-brand-preferences-for-dry-dog-food-based-on-quality/
The Brand Strength Monitor, United States: Brand preferences for dry dog food from February through June 2018, by recent purchase based on quality Statista, https://www.statista.com/statistics/888704/us-brand-preferences-for-dry-dog-food-based-on-quality/ (last visited April 19, 2024)
United States: Brand preferences for dry dog food from February through June 2018, by recent purchase based on quality [Graph], The Brand Strength Monitor, July 31, 2018. [Online]. Available: https://www.statista.com/statistics/888704/us-brand-preferences-for-dry-dog-food-based-on-quality/