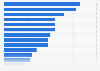
Projected share of technology adoption by companies in U.S. 2022
This statistic shows the share of technology adoption by companies in the United States by 2022. During the survey, 89 percent of the companies surveyed predicted that they would adopt user and entity big data analytics technology by 2022.