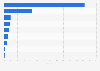
This statistic shows the results of a 2017 survey on the share of addressed direct mail advertisements still in the home after four weeks in the United Kingdom (UK), broken down by sector. In the period of consideration, direct mail advertising for the financial services sector had the highest lifespan, with 22 percent of ads still in the home after four weeks.
Share of addressed direct mail advertisements that stay in home longer than four weeks in the United Kingdom (UK) in 2017, by sector
Basic Account
Get to know the platform
You only have access to basic statistics.
This statistic is not included in your account.
Starter Account
The ideal entry-level account for individual users
- Instant access to 1m statistics
- Download in XLS, PDF & PNG format
- Detailed references
$199 USD / Month *
Professional Account
Full access
Business Solutions including all features.
* Prices do not include sales tax.
Other statistics that may interest you Statistics on
About the industry
9
- Basic Statistic No. of establishments in the advertising industry in the U.S. 2007-2021, by segment
- Premium Statistic Ad spend growth in Western Europe 2000-2024
- Premium Statistic Ad spend growth in Western Europe 2017-2024, by type
- Premium Statistic Revenue of advertising agencies in Norway 2021, by service
- Premium Statistic China's media ad spending 2021-2025, by medium
- Premium Statistic Annual commercial radio revenues in the United Kingdom (UK) 2007-2022, by sector
- Premium Statistic Annual payroll in U.S. advertising services 2017-2021, by sector
- Premium Statistic Brands with highest spending on TV product placement in Poland 2019
- Premium Statistic Public perception of Super Bowl ads in the U.S. 2020
About the region
10
- Premium Statistic Direct mail advertising spending in the UK 2013-2022
- Premium Statistic Largest Meta advertisers in the UK 2018-2022
- Premium Statistic Commercial radio revenue in the United Kingdom (UK) 2007-2022
- Premium Statistic Ability to measure e-mail marketing success in the UK 2013-2021
- Basic Statistic Responses to direct mail in United Kingdom (UK) 2013, by age group
- Premium Statistic Non-digital advertising touchpoints in the UK 2023
- Premium Statistic Radio advertising product sectors ranked by spending in the UK 2022
- Premium Statistic Average one time and monthly gifts to non-profits 2022
- Premium Statistic Regional newsbrands advertising spending in the UK 2011-2022
- Premium Statistic Magazine advertising spending in the UK 2011-2022
Other regions
10
- Premium Statistic Influence of direct mail on purchase decisions in the U.S. 2017, by category
- Premium Statistic Digital ad fraud cost worldwide 2019, by region
- Premium Statistic Consumer reaction to Ramadhan edition instant noodle advertisements Indonesia 2019
- Premium Statistic Brands with the highest recall share in the Indian Premier League 2019
- Premium Statistic Colombia & Mexico: most preferred online ad formats 2017
- Premium Statistic Survey on general perception of usage of English in advertising in Norway 2010-2016
- Premium Statistic Distribution of service provider ad spending in Germany 2022, by type
- Basic Statistic Distribution of ad spend in Brazil 2021, by medium
- Premium Statistic Annual change in advertising spend in Poland 2021-2022, by medium
- Premium Statistic Ad spending distribution in China 2021, by medium
Related statistics
10
- Premium Statistic Awareness of ad blocking in the U.S. Q2 2020
- Premium Statistic Internet user attitudes towards online ads in the U.S. Q2 2020
- Premium Statistic Digital ad fraud cost share worldwide 2019, by region
- Premium Statistic Invalid digital ad traffic share worldwide 2019, by region
- Premium Statistic Digital ad fraud losses worldwide 2023-2028
- Premium Statistic U.S. internet users negative attitude towards ads on websites 2018, by age group
- Premium Statistic U.S. internet users negative attitude towards ads in online videos 2018, by age group
- Premium Statistic Digital ad fraud losses in the U.S. 2011-2021
- Premium Statistic Opinions on online advertising relevance in the U.S. 2019-2023
- Premium Statistic Direct advertising spending in Sweden 2009-2022
Further Content: You might find this interesting as well
Statistics
JICMail. (June 1, 2018). Share of addressed direct mail advertisements that stay in home longer than four weeks in the United Kingdom (UK) in 2017, by sector [Graph]. In Statista. Retrieved April 24, 2024, from https://www.statista.com/statistics/950038/direct-mail-ads-lifespan-by-sector/
JICMail. "Share of addressed direct mail advertisements that stay in home longer than four weeks in the United Kingdom (UK) in 2017, by sector." Chart. June 1, 2018. Statista. Accessed April 24, 2024. https://www.statista.com/statistics/950038/direct-mail-ads-lifespan-by-sector/
JICMail. (2018). Share of addressed direct mail advertisements that stay in home longer than four weeks in the United Kingdom (UK) in 2017, by sector. Statista. Statista Inc.. Accessed: April 24, 2024. https://www.statista.com/statistics/950038/direct-mail-ads-lifespan-by-sector/
JICMail. "Share of Addressed Direct Mail Advertisements That Stay in Home Longer than Four Weeks in The United Kingdom (Uk) in 2017, by Sector." Statista, Statista Inc., 1 Jun 2018, https://www.statista.com/statistics/950038/direct-mail-ads-lifespan-by-sector/
JICMail, Share of addressed direct mail advertisements that stay in home longer than four weeks in the United Kingdom (UK) in 2017, by sector Statista, https://www.statista.com/statistics/950038/direct-mail-ads-lifespan-by-sector/ (last visited April 24, 2024)
Share of addressed direct mail advertisements that stay in home longer than four weeks in the United Kingdom (UK) in 2017, by sector [Graph], JICMail, June 1, 2018. [Online]. Available: https://www.statista.com/statistics/950038/direct-mail-ads-lifespan-by-sector/