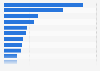
Asian Americans using selected services to watch in-language TV in the U.S. 2019

Most used services for watching in-language content among Asian American television content viewers in the United States as of February 2019

Loading statistic...
Download
Show detailed source information?
Register for free
Already a member?
Log in
Source

Use Ask Statista Research Service

Release date

September 2019

Region

United States

Survey time period

January to February 2019

Number of respondents

307 respondents

Age group

18 years and older

Special properties

among Asian TV content viewers who watch in-language content

Method of interview

Telephone interviews and online survey

Citation formats
Statista Accounts: Access All Statistics. Starting from $2,388 USD / Year
Basic Account
Get to know the platform

You only have access to basic statistics.

Starter Account
The ideal entry-level account for individual users
  • Instant access to 1m statistics
  • Download in XLS, PDF & PNG format
  • Detailed references
$199 USD / Month *
Professional Account
Full access

Business Solutions including all features.

* Prices do not include sales tax.

Statistics on " Ethnic groups in the U.S. - media consumption "

Other statistics that may interest you Ethnic groups in the U.S. - media consumption

Overview

8

African American media

8

Hispanic media

8

Asian media

5

Further related statistics

19
Statista Accounts: Access All Statistics. Starting from $2,388 USD / Year
Learn more about how Statista can support your business.