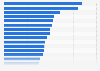
According to a recent report, in 2021 the e-commerce sales channel for many drugstore retailers performed well amid the pandemic. Segments such as prescribed medications made up for 50.6 percent of total e-commerce sales, followed by other goods and services at 40.9 percent.
Distribution of e-commerce sales of pharmacies and drugstores in Sweden during 2021, by segment
Basic Account
Get to know the platform
You only have access to basic statistics.
This statistic is not included in your account.
Starter Account
The ideal entry-level account for individual users
- Instant access to 1m statistics
- Download in XLS, PDF & PNG format
- Detailed references
$199 USD / Month *
Professional Account
Full access
Business Solutions including all features.
* Prices do not include sales tax.
Other statistics that may interest you Statistics on
About the industry
10
- Premium Statistic Sales performance of drugstore e-commerce and brick and mortar retail in Sweden 2023
- Premium Statistic Net sales performance of the community pharmacy retail market in Sweden 2021
- Premium Statistic Distribution of pharmacy retail sales volume in Sweden 2023, by segment
- Basic Statistic Salaries of pharmacists in the U.S. 2022, by setting
- Premium Statistic Number of stores of Rite Aid in the U.S. 2023, by state
- Premium Statistic Sales share of Rite Aid in the U.S. 2023, by product class
- Premium Statistic Total number of stores of Rite Aid in the U.S. 2012-2023
- Basic Statistic Dispensing chemists' monthly retail sales value index in Great Britain 2016-2023
- Basic Statistic Dispensing chemists: sales value quarterly index in Great Britain 2015-2024
- Premium Statistic Drugstores OTC medical products sales revenue in Japan 2014-2022
About the region
10
- Basic Statistic Value of pharmaceutical sales in Sweden 2000-2022
- Basic Statistic Sales value of subsidized pharmaceuticals in Sweden 2008-2022
- Basic Statistic Pharmacy revenue share in Sweden 2023, by type of product
- Premium Statistic Plantasjens Group sales share 2020, by country
- Basic Statistic Plantasjen Group EBITA margin development 2016-2020
- Basic Statistic Sales value of prescription pharmaceuticals in Sweden 2008-2022
- Premium Statistic Net sales of Apotek Hjärtat in Sweden 2014-2023
- Basic Statistic Expenditure on nonprescription pharmaceuticals in Sweden 2009-2023
- Basic Statistic Expenditure on pharmaceuticals in Sweden 2009-2023
- Premium Statistic Market share of Apotek Hjärtat in Sweden 2015-2022
Selected statistics
1
Other regions
10
- Basic Statistic Largest nonprescription pharmaceutical companies in Norway 2021, by market share
- Basic Statistic Number of consumers of pharmaceutical drugs in Italy 2010-2022
- Basic Statistic Value of pharmaceutical sales in Slovenia 2010-2022
- Premium Statistic Latin America nonprescription drugs sales 2015-2020, by country
- Premium Statistic Brazil: net sales of Raia Drogasil 2013-2016
- Premium Statistic Total spending on non-original branded pharmaceuticals in China 2008-2023
- Premium Statistic Number of website visits to Farmalisto
- Premium Statistic Taisho Pharmaceutical's employee number FY 2013-2020
- Premium Statistic Value of pharmaceutical sales in Denmark 2000-2021
- Basic Statistic Value of pharmaceutical sales in Iceland 2001-2021
Related statistics
10
- Premium Statistic Impact of COVID-19 on OTC healthcare sales in Italy 2020
- Premium Statistic U.S. revenue of Rite Aid from 2017 to 2023 by segment
- Basic Statistic Dispensing chemists: retail sales volume index monthly in Great Britain 2016-2023
- Premium Statistic Walgreens pharmacy retail sales in the U.S. 2018-2023, by division
- Premium Statistic Walgreens Boots Alliance sales worldwide 2018-2023, by geographical region
- Basic Statistic Pharmacy sales growth in Denmark January to April 2020
- Premium Statistic Sales value of OTC health and personal care products in the U.S. in 2018, by type
- Premium Statistic Sales growth of OTC health care products in the U.S. 2018, by type
- Premium Statistic Sales growth of OTC non-health care products in the U.S. by type 2018
- Premium Statistic New locations and closings of Walgreens stores in the U.S. 2005-2013
Further related statistics
10
- John Lewis sales revenue in the United Kingdom (UK) 2009-2023
- Waitrose sales revenue in the United Kingdom (UK) 2009-2023
- Tesco's sales worldwide 2016/2017-2022/2023, by region
- Electrical appliances retail sales volume index in Great Britain (UK) 2013-2023
- Secondhand goods: Sales volume percentage change in Great Britain (UK) 2013-2023
- Company-operated Starbucks stores retail sales distribution worldwide 2005-2023
- Walgreens gross profit and net earnings in the U.S. 2005-2023
- Walgreens operating income in the U.S. 2005-2023
- U.S. milk sales growth: leading vendors of white milk 2023
- Leading online retailers in Southeast Asia 2020, by monthly visits
Further Content: You might find this interesting as well
Statistics
- John Lewis sales revenue in the United Kingdom (UK) 2009-2023
- Waitrose sales revenue in the United Kingdom (UK) 2009-2023
- Tesco's sales worldwide 2016/2017-2022/2023, by region
- Electrical appliances retail sales volume index in Great Britain (UK) 2013-2023
- Secondhand goods: Sales volume percentage change in Great Britain (UK) 2013-2023
- Company-operated Starbucks stores retail sales distribution worldwide 2005-2023
- Walgreens gross profit and net earnings in the U.S. 2005-2023
- Walgreens operating income in the U.S. 2005-2023
- U.S. milk sales growth: leading vendors of white milk 2023
- Leading online retailers in Southeast Asia 2020, by monthly visits
Sveriges Apoteksförening. (March 31, 2022). Distribution of e-commerce sales of pharmacies and drugstores in Sweden during 2021, by segment [Graph]. In Statista. Retrieved May 08, 2024, from https://www.statista.com/statistics/1236487/shares-of-e-commerce-sales-for-swedish-drugstore-segments/
Sveriges Apoteksförening. "Distribution of e-commerce sales of pharmacies and drugstores in Sweden during 2021, by segment." Chart. March 31, 2022. Statista. Accessed May 08, 2024. https://www.statista.com/statistics/1236487/shares-of-e-commerce-sales-for-swedish-drugstore-segments/
Sveriges Apoteksförening. (2022). Distribution of e-commerce sales of pharmacies and drugstores in Sweden during 2021, by segment. Statista. Statista Inc.. Accessed: May 08, 2024. https://www.statista.com/statistics/1236487/shares-of-e-commerce-sales-for-swedish-drugstore-segments/
Sveriges Apoteksförening. "Distribution of E-commerce Sales of Pharmacies and Drugstores in Sweden during 2021, by Segment." Statista, Statista Inc., 31 Mar 2022, https://www.statista.com/statistics/1236487/shares-of-e-commerce-sales-for-swedish-drugstore-segments/
Sveriges Apoteksförening, Distribution of e-commerce sales of pharmacies and drugstores in Sweden during 2021, by segment Statista, https://www.statista.com/statistics/1236487/shares-of-e-commerce-sales-for-swedish-drugstore-segments/ (last visited May 08, 2024)
Distribution of e-commerce sales of pharmacies and drugstores in Sweden during 2021, by segment [Graph], Sveriges Apoteksförening, March 31, 2022. [Online]. Available: https://www.statista.com/statistics/1236487/shares-of-e-commerce-sales-for-swedish-drugstore-segments/