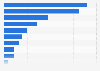
This graphic depicts the total production revenue in France from 2011 to 2018, in billion euros. During the period studied, the total production income in France continuously grew. In 2011, the total production in France generated 3,685 billion euros and reached an estimated 3,164 billion euros in 2018.
Total production revenue in France from 2011 to 2018 (in billion euros)
Loading statistic...
Basic Account
Get to know the platform
You only have access to basic statistics.
Starter Account
The ideal entry-level account for individual users
- Instant access to 1m statistics
- Download in XLS, PDF & PNG format
- Detailed references
$199 USD / Month *
Professional Account
Full access
Business Solutions including all features.
* Prices do not include sales tax.
Other statistics that may interest you Statistics on
About the industry
10
- Basic Statistic Number of SMEs in the UK 2023, by sector
- Basic Statistic UK small & medium enterprises (SME) with 'worse than average' financial risk rating
- Basic Statistic UK SMEs with 'minimal' or 'low' risk rating 2014-2019, by industry sector
- Basic Statistic Number of male and female CEOs Australia FY 2019, by industry
- Basic Statistic Share of male and female CEOs in Australia FY 2019, by industry
- Basic Statistic Share of male and female KMPs Australia FY 2019, by industry
- Basic Statistic Number of male and female business directors Australia FY 2019, by industry
- Premium Statistic Number of Norwegian-controlled agriculture and fishing enterprises abroad 2008-2018
- Premium Statistic U.S. firms in forestry, fishing, hunting and agriculture industry 2019-2026
- Basic Statistic Profitability of UK agricultural sector small & medium enterprises (SME) in 2014-2019
About the region
10
- Basic Statistic Distribution of the workforce across economic sectors in France 2021
- Basic Statistic Distribution of gross domestic product (GDP) across economic sectors in France 2022
- Premium Statistic Goods export revenue in France 2021, by type of product
- Premium Statistic Main sectors of activity of French companies branches in Germany 2017
- Premium Statistic Product and service categories most purchased online in France 2023
- Premium Statistic Maize or corn export value from France 2010-2022
- Basic Statistic Oats export value from France 2010-2022
- Premium Statistic Cereals export value from France 2022, by type
- Basic Statistic Oats import value by France 2010-2022
- Premium Statistic Cereals import value to France in 2022, by type
Other regions
10
- Premium Statistic Electricity consumption New Zealand 2022, by type
- Basic Statistic Share of economic sectors in the GDP in Malaysia 2022
- Basic Statistic Employment by economic sector in Lebanon 2021
- Basic Statistic Employment by economic sector in Slovakia 2021
- Basic Statistic Employment by economic sector in Austria 2021
- Basic Statistic Employment by economic sector in the Czech Republic 2021
- Basic Statistic Employment by economic sector in Jamaica 2021
- Basic Statistic Employment by economic sector in El Salvador 2021
- Basic Statistic Employment by economic sector in Tanzania 2011 to 2021
- Basic Statistic Employment by economic sector in Egypt 2022
Related statistics
10
- Basic Statistic Imports of trade goods and services in Canada 2000-2022
- Basic Statistic Balance of trade in goods and services in Canada 2000-2022
- Basic Statistic Number of jobs in Yukon 2022, by NAICS category
- Basic Statistic Number of jobs in Nunavut 2022, by NAICS category
- Basic Statistic Number of jobs in Saskatchewan 2022, by NAICS category
- Basic Statistic Number of jobs in Prince Edward Island 2022, by NAICS category
- Basic Statistic Number of jobs in Nova Scotia 2022, by NAICS category
- Basic Statistic Number of jobs in New Brunswick 2022, by NAICS category
- Basic Statistic Number of jobs in Quebec 2022, by industry
- Basic Statistic Number of jobs in Manitoba 2022, by NAICS category
Further related statistics
10
- U.S. total apple production 2000-2022
- BayWa's revenue by segment 2010-2022
- Glencore's net income 2010-2023
- Glencore's sales of energy products 2010-2023
- Total U.S. domestic grain use 2001-2023
- Rio Tinto's uranium production 2010-2023
- Rio Tinto's diamond production 2010-2023
- Bunge Limited's total assets 2007-2023
- CF Industries' revenue 2010-2022
- Archer Daniels Midland's revenue 2006-2022
Further Content: You might find this interesting as well
Statistics
- U.S. total apple production 2000-2022
- BayWa's revenue by segment 2010-2022
- Glencore's net income 2010-2023
- Glencore's sales of energy products 2010-2023
- Total U.S. domestic grain use 2001-2023
- Rio Tinto's uranium production 2010-2023
- Rio Tinto's diamond production 2010-2023
- Bunge Limited's total assets 2007-2023
- CF Industries' revenue 2010-2022
- Archer Daniels Midland's revenue 2006-2022
Insee. (February 27, 2020). Total production revenue in France from 2011 to 2018 (in billion euros) [Graph]. In Statista. Retrieved April 28, 2024, from https://www.statista.com/statistics/469382/total-production-in-france/
Insee. "Total production revenue in France from 2011 to 2018 (in billion euros)." Chart. February 27, 2020. Statista. Accessed April 28, 2024. https://www.statista.com/statistics/469382/total-production-in-france/
Insee. (2020). Total production revenue in France from 2011 to 2018 (in billion euros). Statista. Statista Inc.. Accessed: April 28, 2024. https://www.statista.com/statistics/469382/total-production-in-france/
Insee. "Total Production Revenue in France from 2011 to 2018 (in Billion Euros)." Statista, Statista Inc., 27 Feb 2020, https://www.statista.com/statistics/469382/total-production-in-france/
Insee, Total production revenue in France from 2011 to 2018 (in billion euros) Statista, https://www.statista.com/statistics/469382/total-production-in-france/ (last visited April 28, 2024)
Total production revenue in France from 2011 to 2018 (in billion euros) [Graph], Insee, February 27, 2020. [Online]. Available: https://www.statista.com/statistics/469382/total-production-in-france/