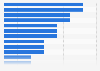


Super Bowl TV ratings in the U.S. 1990-2024
In 2024, Super Bowl LVII between the Kansas City Chiefs and the San Francisco 49ers achieved a TV rating of 42.1, up from the all-time low of 36.9 two years prior. In total, the number of Super Bowl viewers exceeded a record 123 million in 2024.


