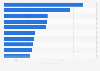
This statistic presents the share of smartphone video users who have paid for mobile video content as of May 2015, by region. During the survey period, it was found that 23 percent of respondents from the United States and Canada have paid for a video that they have watched on their smartphone.
Share of smartphone video users who have paid for mobile video content as of May 2015, by region
Loading statistic...
Basic Account
Get to know the platform
You only have access to basic statistics.
Starter Account
The ideal entry-level account for individual users
- Instant access to 1m statistics
- Download in XLS, PDF & PNG format
- Detailed references
$199 USD / Month *
Professional Account
Full access
Business Solutions including all features.
* Prices do not include sales tax.
Other statistics that may interest you Statistics on
About the industry
10
- Premium Statistic Video consumption among Asian Americans in the U.S. 2019, by device
- Premium Statistic Television usage via the internet in Germany 2011-2023
- Premium Statistic Share of individuals downloading paid videos daily in Norway 2009-2020
- Premium Statistic U.S. tablet video viewing frequency 2016
- Premium Statistic U.S. smartphone video viewing frequency 2016
- Premium Statistic YouTube: most subscribed gaming channels 2024
- Premium Statistic YouTube: share of social network website visits in the United Kingdom (UK) 2018-2024
- Premium Statistic Twitch: most followed channels 2024
- Premium Statistic Average monthly time spent viewing online video in China 2020-2023
- Premium Statistic Number of monthly active short video users in China 2018-2023
About the region
10
- Premium Statistic Netflix's quarterly net income 2013-2024
- Premium Statistic OTT video revenue worldwide from 2010 to 2029
- Basic Statistic YouTube: most subscribed channels 2024
- Premium Statistic Most viewed movie trailers in their first 24 hours as of April 2023
- Basic Statistic Number of Crunchyroll subscribers 2012-2024
- Premium Statistic YouTube: most subscribed soccer clubs 2018
- Basic Statistic Share of internet users who watch online videos 2018, by country
- Basic Statistic Daily online video usage in selected countries 2018
- Premium Statistic Monthly usage of paid video streaming services worldwide 2017, by age
- Premium Statistic Quarterly Netflix subscribers count worldwide 2013-2024
Other regions
9
- Premium Statistic Video consumption among African Americans in the U.S. 2016, by age
- Premium Statistic Mobile app downloading penetration in Mexico 2016, by gender
- Premium Statistic Netherlands: online video consumption via smartphone 2016
- Premium Statistic France: online video consumption via computer 2016
- Premium Statistic Serbia: online video consumption via smartphone 2016
- Premium Statistic Hungary: online video consumption via computer 2016
- Premium Statistic Spain: online video consumption via smartphone 2016
- Premium Statistic Switzerland: online video consumption via smartphone 2016
- Premium Statistic Greece: online video consumption via smartphone 2016
Related statistics
10
- Premium Statistic YouTube monthly web visit share in Italy 2018-2023
- Basic Statistic YouTube usage frequency in the United States 2020
- Premium Statistic Weekly use of streaming services during COVID-19 in the Nordics 2020
- Basic Statistic Most popular entertainment apps in the U.S. 2019, by reach
- Premium Statistic Most popular live streaming video platforms in the U.S. 2016, by reach
- Basic Statistic Most-visited video platforms of U.S. Hispanics 2016
- Premium Statistic U.S. mobile phone video viewership growth 2014-2020
- Basic Statistic YouTube: most viewed channels 2024
- Basic Statistic YouTube: most subscribed beauty content creators 2024
- Basic Statistic All-time most viewed YouTube channel owners 2024
Further related statistics
9
- Netflix's annual revenue 2002-2023
- Use of a smart TV to go online in the UK 2013-2020, by age
- U.S. students who watch at least three hours of TV a day 2017
- Device preference for internet browsing in the United Kingdom (UK) 2015, by age
- Consumer magazine industry revenue in North America 2008 -2016
- Magazine publishing revenue in Western Europe 2009-2016, B2B and B2C
- Magazine publishing revenue in Central & Eastern Europe 2009-2016, by B2B and B2C
- Concerns about connected devices use in the United Kingdom (UK) 2013-2014
- U.S. cell phone owners who use mobile banking 2013, by ethnicity
Further Content: You might find this interesting as well
Statistics
- Netflix's annual revenue 2002-2023
- Use of a smart TV to go online in the UK 2013-2020, by age
- U.S. students who watch at least three hours of TV a day 2017
- Device preference for internet browsing in the United Kingdom (UK) 2015, by age
- Consumer magazine industry revenue in North America 2008 -2016
- Magazine publishing revenue in Western Europe 2009-2016, B2B and B2C
- Magazine publishing revenue in Central & Eastern Europe 2009-2016, by B2B and B2C
- Concerns about connected devices use in the United Kingdom (UK) 2013-2014
- U.S. cell phone owners who use mobile banking 2013, by ethnicity
IAB (U.S.). (June 8, 2015). Share of smartphone video users who have paid for mobile video content as of May 2015, by region [Graph]. In Statista. Retrieved April 26, 2024, from https://www.statista.com/statistics/444779/smartphone-users-who-paid-for-mobile-video-content-by-region/
IAB (U.S.). "Share of smartphone video users who have paid for mobile video content as of May 2015, by region." Chart. June 8, 2015. Statista. Accessed April 26, 2024. https://www.statista.com/statistics/444779/smartphone-users-who-paid-for-mobile-video-content-by-region/
IAB (U.S.). (2015). Share of smartphone video users who have paid for mobile video content as of May 2015, by region. Statista. Statista Inc.. Accessed: April 26, 2024. https://www.statista.com/statistics/444779/smartphone-users-who-paid-for-mobile-video-content-by-region/
IAB (U.S.). "Share of Smartphone Video Users Who Have Paid for Mobile Video Content as of May 2015, by Region." Statista, Statista Inc., 8 Jun 2015, https://www.statista.com/statistics/444779/smartphone-users-who-paid-for-mobile-video-content-by-region/
IAB (U.S.), Share of smartphone video users who have paid for mobile video content as of May 2015, by region Statista, https://www.statista.com/statistics/444779/smartphone-users-who-paid-for-mobile-video-content-by-region/ (last visited April 26, 2024)
Share of smartphone video users who have paid for mobile video content as of May 2015, by region [Graph], IAB (U.S.), June 8, 2015. [Online]. Available: https://www.statista.com/statistics/444779/smartphone-users-who-paid-for-mobile-video-content-by-region/