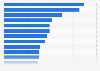


Social media platform features usage frequency in the United States 2018
This statistic presents the frequency of social media platform feature usage in the United States as of February 2018. According to the results, 47 percent of surveyed internet users in the United States stated that they preferred to use Facebook for news feed feature, while in comparison only six percent stated similar preferences in use for Instagram.